Launching our Experiment Registry: What we’ve learned from 10 years of iterative experimentation at PxD
- January 28, 2026
- 12 minutes read


When you send digital advice to tens of millions of farmers, how do you know which kinds of message framing and message styles farmers pay the most attention to? And how do you know if they understood the message and acted on it, and if it made any difference for farmers’ outcomes?
At PxD, we use experiments to answer exactly these design questions. We typically start with experiments that compare different versions of our services—A/B testing—to determine which design choices work best. Once we’ve optimized the service, we measure the overall impact by randomly assigning farmers to either receive or not receive our services. By comparing outcomes across randomly assigned groups, we can confidently say whether our design choices drive farmer engagement and behavior change, and whether the service itself delivers a measurable impact. This evidence-based approach supports cost-effective learning for service improvement by first optimizing what we deliver, then rigorously measuring the overall impact at scale.
In the ten years since PxD’s founding, our teams across geographies have run over one hundred trials, to identify what works, rigorously measure impact, and incorporate improvements to our services. We started systematically documenting these trials in 2021, and, in the last year, we went back through early project reports to compile a registry of those with complete documentation.
Today, we’re releasing our Experiment Registry with 80 trials.
The Registry offers an open and accessible resource to share PxD’s experience with other organizations that are building digital services, in order to strengthen learning across the ecosystem. This blog post highlights what you’ll find in the Registry and key insights from our decade of experimentation.
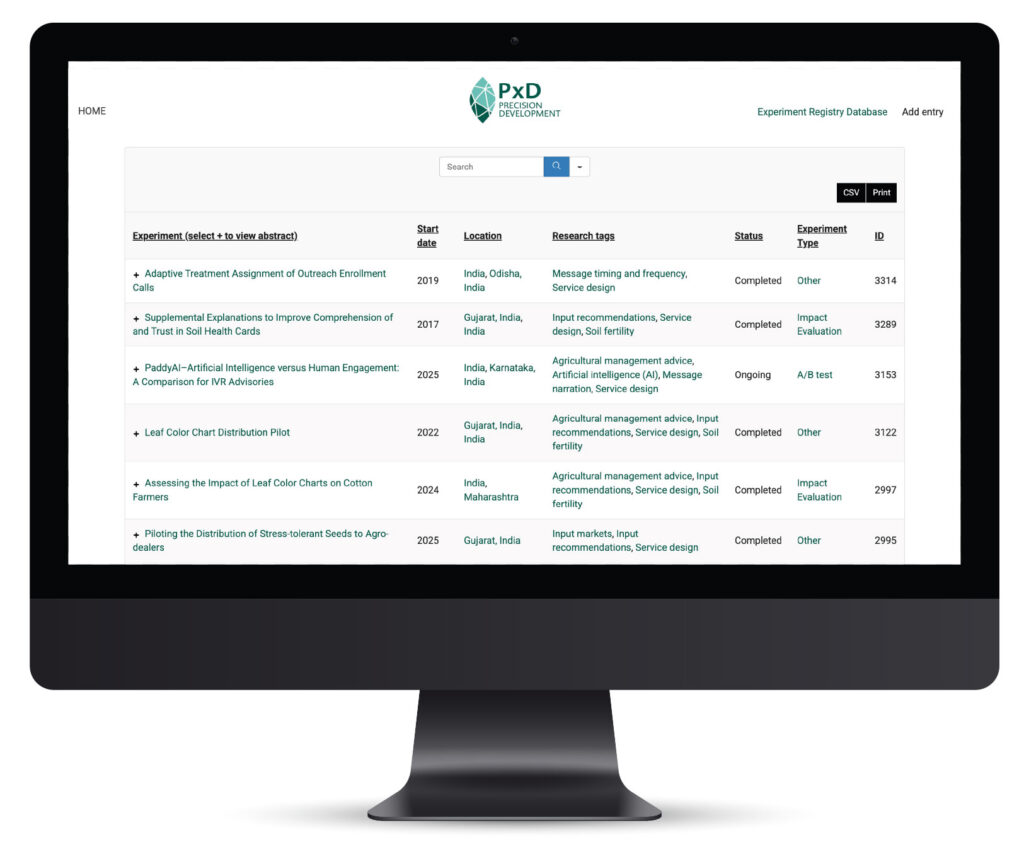
What’s in the Experiment Registry?
The Registry summarizes experiments that we have run to test specific changes in service design and measure the changes’ effects, and to measure the effects of receiving PxD’s services overall. The experiments range from simple A/B tests of service variants to large-scale impact evaluations and randomized controlled trials (RCTs) with a control group that did not receive PxD’s services. The Registry includes experiments that we conducted on our own services and in collaboration with partners, such as One Acre Fund (OAF; Kenya and Rwanda), the Agricultural Transformation Institute (ATI; Ethiopia), The Government of Odisha (India), and the Coffee Board of India.
Most of our experiments—over 80% of the trials—focus on digital agricultural advisory services. These comprise 15 trials that tested whether digital agricultural messages work at all—comparing farmers who received digital advice to those who didn’t receive advice—and 53 trials that tested which version works best—comparing different message content, communication styles, and message timing and frequency, with the aim of optimizing service design. Beyond experiments on digital agriculture messaging, we have also explored a range of questions—how to improve loan repayment through SMS reminders, how do farmers interpret probabilistic weather information in a lab-in-the-field setting, what is the impact of providing farmers with loans for agricultural infrastructure investments, and what are effective distribution channels for agricultural inputs.
Nearly all the trials focused on agricultural advisory, and took place across Kenya (36 trials), India (23 trials), Ethiopia (9 trials), Rwanda (6 trials), and a few other countries. The various fields of the Registry can be searched and filtered, and the results of these searches are exportable.
Four things we learned
Overall, design optimization can meaningfully improve the impact of our services. In 38 of our 53 (69%) A/B tests on design optimization, the specific variant tested had a measurable effect on outcomes. This “rate of discovery” for efficiency improvements compares well with the 59% reported by Angrist et al. (2025) on 12 rapid experiments conducted by Youth Impact. The same paper notes that the benchmark “rate of discovery” is 10–40% in tech companies. Here are some key insights from PxD’s experimental work.
1. Digital agricultural advisory works—and works consistently
Thirteen of our 15 experiments (87%) with a pure control group that received no digital advice found clear positive effects. The majority measured farmer knowledge or adoption of recommended farming practices through phone surveys. Our largest trial of a comprehensive advisory service at scale in India, Ama Krushi, which was specifically designed to measure agricultural outcomes in the state of Odisha, found that customized digital advice increases yields and reduces crop loss, and returns $12–19 in additional farmer income for every dollar invested (trial 1252; Cole et al. 2025). In Kenya we evaluated the impact of SMS messages on agricultural lime adoption by farmers and found that the messages significantly increased adoption by 30%, according to OAF administrative data on input purchases (trial 1490; Fabregas et al. 2024).
The pattern holds across geographies and across various advisory content, crops, and seasons, as well as across different delivery channels.
2. Services show large impacts when responding to urgent needs
Digital advisory works on average, but it is particularly effective when farmers face unforeseen shocks.
The Ama Krushi service in Odisha showed modest average effects. But in areas hit by weather shocks—too much or too little rain at critical times—the effect was much greater, with farmers using the service seeing 9% yield increases and 21% reductions in severe crop loss (trial 1252).
Similarly, when farmers in Kenya were affected by Fall Armyworm, an invasive new pest that threatened complete crop loss, 2-way SMS campaigns about the pest drove double the normal platform engagement (trial 1391). And voice-based advice sent to coffee farmers in Karnataka, India on management of white stem borer, an invasive pest that destroys coffee plants, led to a 6 percentage point increase in self-reported adoption of key management practices (trial 1670).
3. The biggest wins come from removing actual barriers, not tweaking messages based on theories alone
There is enormous variation in effect sizes across our design optimization trials. Some changes barely moved the needle. Others increased engagement by 10–20 percentage points for affected user-segments.
One insight that emerges from the patterns in the findings is the importance of designing improvements to address the actual barriers that farmers face.
When usage data showed that 10% of Ethiopian farmers calling ATI’s Farmers’ Hotline didn’t press any button when prompted by the menu, we added automatic menu replay. For those affected farmers, content access increased by 17 percentage points (trial 1247). Similarly, when data showed many farmers in India hanging up within 10 seconds of answering our calls, we removed the 8-second introductory jingle. Listening rates increased by 18 percentage points (trial 1444).
We saw the same pattern with language barriers. Using local dialects in Bangladesh instead of the standard Bangla language improved listening rates by 4 percentage points and call completion by 7 percentage points (trial 1545). Offering remote training to Indian farmers on how to use our inbound calling service led to a 22-fold increase in the rate of farmers asking a valid agricultural question (trial 1415).
These improvements worked because they removed real friction. We had data showing where users struggled, and we designed solutions for those specific bottlenecks.
By contrast, many of our message-framing experiments—testing whether farmers respond better to gain-framed vs. loss-framed messages, for instance, or whether they prefer message variety vs. consistency—found minimal or no differences. We tested five different behavioral message frames for down payment reminders to qualify OAF clients to receive agricultural inputs on credit, and we found that reminders worked (increasing down payments by 1.7 percentage points), but all the frame variations performed about the same (trial 1381). When we tested whether, due to farmers’ loss aversion, loss-framed opt-in messages would increase the proportion of Kenyan farmers opting-in to PxD’s MoA-INFO seasonal cropping series advisory, we found that these messages actually decreased opt-ins by 7% (trial 1631). When we customized nudge messages for extension agents based on their personality traits, measured via a phone survey, we saw no difference in agent performance (trial 1710).
The distinction: We were trying to predict psychological preferences or behavioral biases without addressing observable constraints. When we tested message clarity, information relevance, or friction reduction instead—all addressing things we could see users struggling with—we saw much higher success rates and larger effects.
This doesn’t mean that insights from behavioral sciences aren’t helpful: It means that we need to apply them when we observe patterns of specific behavioral barriers in actual users.
4. Farmers face different constraints: Services should be designed to accommodate heterogeneity
The effects of digital advisory services aren’t uniform. Sometimes that’s because some farmers face acute problems that others don’t: Weather shocks hit certain areas, or certain land types are prone to flooding. But sometimes the difference is because certain farmers face barriers that others don’t face.
Menu replay helped the 10% who struggled with phone navigation (referenced above, trial 1247). Flood-tolerant seed messages resonated with farmers on flood-prone land (trial 1434). Reminder messages had larger effects on farmers who were already actively engaged with the platform (trial 1397). A comprehensive advisory service was particularly helpful for farmers who faced weather shocks, such as excess or inadequate rainfall (referenced above, trial 1252). Customizing advisory message timing using machine learning on historical engagement data reveals larger gains for users with below-median pick-up rates prior to the experiment compared to users with above-median pick-up rates (trial 1679).
This pattern highlights an important principle: Effective services can increase in value as they accommodate a greater range of farmer constraints—whether acute problems that arise unpredictably (e.g., weather shocks and pest outbreaks) or barriers affecting specific segments (e.g., digital literacy, language, engagement level). Optimizing for the ‘average farmer in an average season’ might mean missing both the highest-impact opportunities and critical needs for accessibility.
Finally, these understandings developed as we built our experimentation capacity. Early tests—including those showing no effect—were as much about learning how to ask the right questions and how to set up experiments and engage with data, as about finding answers. Over time, this muscle-building translates into more strategic testing that better informs service design, even when individual tests show null results.
Emerging design questions
As we continue experimenting, three areas stand out as particularly promising:
Understanding long-term effects. Most of our experiments measured engagement over several weeks and adoption at the end of the season. But do design improvements sustain their impact over time, or do they create short-lived “novelty” effects? How do user preferences change over time? When users first encounter a new delivery channel, different menu options, or a new voice narrator, initial engagement may not predict long-term behavior. Testing how effects persist—or fade—would sharpen our understanding of what truly works and what is most cost-effective in improving our service offerings.
Communicating uncertain information in real time. We’ve observed that digital advice tends to generate high engagement when farmers face unpredictable events like weather shocks and pest outbreaks. As climate variability intensifies, farmers increasingly need information in real time to support their decision-making that comes with uncertainty—information such as probabilistic weather forecasts, price range predictions, and pest risk assessments. Understanding what, when, and how to communicate uncertain information effectively could yield significant returns for farmers to decide the best course of action for their individual circumstances.
Personalizing through machine learning and generative AI. Machine learning (ML) offers a path to scale the heterogeneity-responsive approach. Instead of trying to infer psychological preferences, ML could identify and address observable friction points at the individual level. Historically, the data requirements made this approach difficult at scale. As technologies advance and data integration improves, opportunities are emerging to test how personalization—both ML-based and, more recently, generative AI-led voice advisory—can be used at low cost to improve outcomes beyond the simpler, constraint-based optimizations that have been effective so far.
What this means: Continuing ‘learning by doing’
Our experiments, alongside the growing evidence base on digital services for agriculture, demonstrate that well-designed digital services enable farmers to make informed decisions and achieve improved outcomes at scale. The frontier has shifted from proving that the model works to optimizing services to deliver as much impact as possible.
As we continue this work, we reflect on:
Making experimentation more accessible. A/B testing requires thoughtful design, clear metrics, and the synthesis of insights—work that takes time, even when it’s considered “low cost” compared to traditional evaluations. Tools can help. For instance, we recently piloted Evidential, the Agency Fund’s plug-in that automates power calculations, randomization, and analysis, for digital messaging platforms. Evidential dramatically reduced setup time, and we’re integrating it across our services.
Sharing learnings across organizations. As more implementers engage in A/B testing, shared documentation standards could greatly reduce the cost of synthesizing insights from different sources. This Registry is our contribution to that effort, and we’re exploring ways to make it even more useful—like facilitating meta-analysis. We hope our Registry encourages others to share their learnings too.
Building capacity to learn in-house. Funding for implementers to build experimentation systems and analytical capacity has traditionally been limited. While external research partnerships provide valuable expertise, implementers’ internal capacity is what enables us to leverage those partnerships effectively. Internal teams based in our countries of operation are best positioned to identify relevant questions, prioritize problems, and integrate learnings into daily decisions. Learning works best when the learners are also the doers and are in close contact with our user base.
More about the Experiment Registry
The Registry currently includes 80 trials with sufficient documentation of research questions, intervention descriptions, and experimental designs to be publicized in the Registry (results of five trials are undergoing analysis). The Registry consists of roughly 65% of all the trials that we conducted from 2016 to 2025. We will continue to update results and add new entries to the Registry over time.
A few caveats: We’re not sharing underlying data due to evolving data regulations in countries where we operate. Results are drawn from working papers, pre-analysis plans, funder reports, and project documents that were prepared by project teams. This is a snapshot of our learning; it is not a perfect archive.
We hope that this Experiment Registry serves as a resource for others who are building digital services for users in low-resource settings. Over the coming months, we’ll highlight a few A/B tests on topics related to current and ongoing work, including the communication of weather forecasts, and AI-generated vs. human-generated advisory (trial 3153—early results are highlighted in this Agency Fund blog post—more to come soon!) We invite you to browse the PxD Experiment Registry, and please get in touch if you’d like to learn more.

Stay Updated with Our Newsletter

Make an Impact Today