Women play important roles in smallholder dairy production. As PxD prepares to roll out a dairy advisory initiative in Kenya, we conducted a gender survey to better understand the division of labor within households. In this post, the second of a two-part series, Sam Strimling, Research Associate, presents an analysis of the results. The first post laid out the importance of understanding the specific needs of women in designing effective service delivery for women.

In many smallholder households, labor relating to the tending of livestock – particularly dairy animal husbandry and dairy production – is derived disproportionately from women. This culturally entrenched division of labor has direct implications for PxD as we expand into supporting dairy farming activities and seek to target our digital advisory services appropriately.
There is a plethora of evidence – much of it detailed in the excellent book, Invisible Women, by Caroline Criado Pérez – of service providers who failed to understand women’s specific needs and preferences and thus designed inferior products. Providers of digital advisory services are no exception to this disappointing phenomenon.
As PxD prepares to roll out a dairy advisory initiative in Kenya, we considered it a top priority to conduct a gender survey to better understand the roles played by each household member with a focus on tasks performed, decision-making, and financial agency. The results of this survey will be used to inform the dairy content we are developing as part of an upcoming randomized controlled trial (RCT) we are implementing in partnership with several dairy cooperatives across different regions in Kenya. We will use the results of the survey to inform the type of content we write, as well as how and to whom we deliver it.
As detailed in a previous blog post about the survey, the PxD Kenya team used a novel and rich dataset to inform survey design. In addition to gaining insights into the roles played by different members of the household, we also sought to better understand the technical and analytical abilities of each respondent, as well as perceived technical knowledge for each household member. Finally, we used methods from behavioral economics to empirically evaluate trust within the household.
Survey Structure
We started with a total sample of 600 households randomly selected from two dairy cooperatives, in the Rift Valley and Eastern regions. The sample was stratified by geography, milk sales to the dairy, and deductions for purchases from the dairy-affiliated agrovet (in which farmers are able to purchase animal medicines and farming inputs using income from milk).
We called 464 unique respondents, of whom 357 answered at least one call. Respondents who lived with or made decisions with their spouses were asked to provide contact information. Single respondents – many of whom were widows or widowers – were encouraged to complete the survey, but were not asked a series of subjective questions about the degree to which they made decisions or discussed activities with their spouses. Single respondents were also not asked to participate in the public goods game. In total, 114 spousal pairs completed the full survey. These spouses, and their respective households, will be the focus of this post. The demographics of the survey respondents and their households are shown in the table below.
Intra-household dairy roles. At the start of the survey, each respondent was asked to list the members of the household above the age of five, and state their age, gender, and education. The survey enumerators used tablets to record responses that allowed them to capture this information to be used later in the survey. Respondents were then asked to select from this list to indicate which member(s) of the household:
- Practiced crop farming, grazing, fetching water, wage employment [Respondents were specifically asked if they held “a job outside the home.”], schoolwork, childcare, and/or leisure in any given week. Respondents were also asked to indicate the number of hours each selected household member spent on each task in a typical day.
- Practiced various dairy tasks, selected from a list of tasks generated by our Staff Dairy Livestock Expert. For each task selected, respondents were asked to indicate which household member took primary responsibility, and how many minutes this individual typically spent on that task per day. This is the only household roster question for which the respondent was asked to select a single respondent rather than having the option to select multiple members.
- Were knowledgeable about nutrition, artificial insemination, hygiene, disease, and feed and fodder. The respondent was also asked to rank the selected household members in terms of their knowledge on that particular topic.
- Had taken various financial actions, including purchased a personal asset, purchased a productive asset, sold crops on behalf of the household, received payment for crops on behalf of the household, received payment for milk production, and made decisions about spending dairy income.
Analytical ability and dairy knowledge. Respondents were asked to answer a series of scenario-based analytical questions as well as questions to assess technical dairy knowledge on a broad range of topics. We then calculated the percentage of analytical and technical questions the respondent answered correctly.
Subjective assessment of financial agency and cooperation. Respondents were also asked to provide information on their personal knowledge and feelings of financial agency. To assess financial agency, respondents were asked to indicate using a Likert scale the degree to which they discussed finances with their spouse, trusted their spouse’s financial decisions, talked with their spouses about agricultural work, and talked with their spouse about their day generally.
Intra-household cooperation – the public goods game. Finally, all respondents who completed the survey were awarded 100 Ksh (approximately $1) in airtime, and – if their corresponding spouse had also completed the survey – they were invited to increase their earnings by contributing some portion of their earnings into a common account with their spouse. Since the amount contributed to this common account was doubled and then split evenly, the respondent’s contribution could be interpreted as an empirical measurement of cooperation with their spouse.
Information asymmetry. For the 115 households in which we collected information from both spouses, we were able to calculate the degree of coherence in their responses in terms of the intra-household (inter-spousal) correlation coefficient.
General Time Use & Dairy Tasks
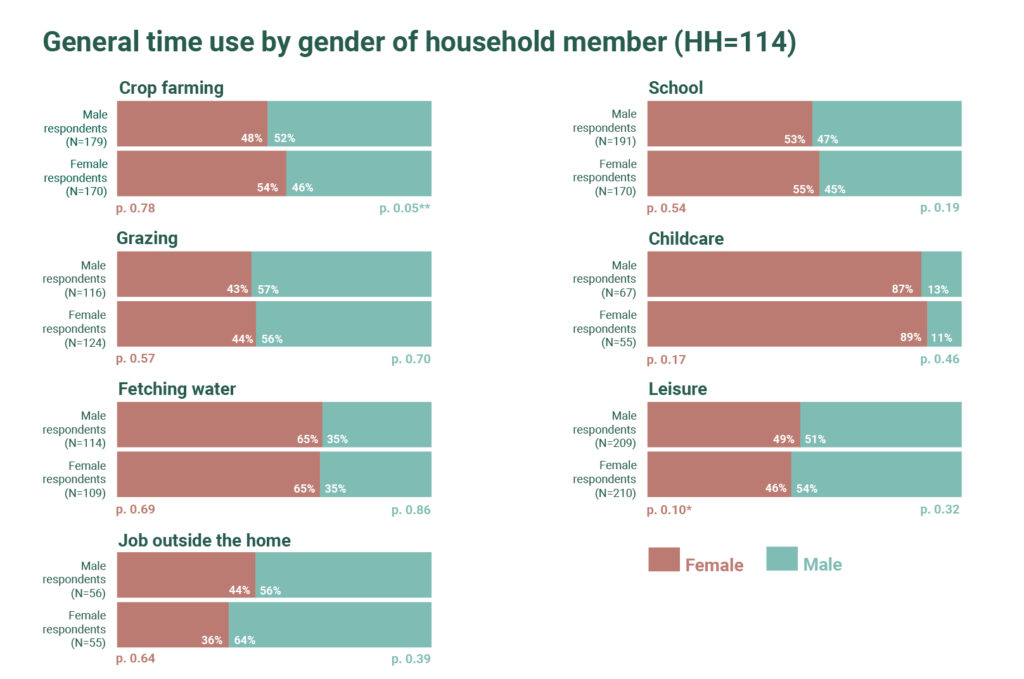
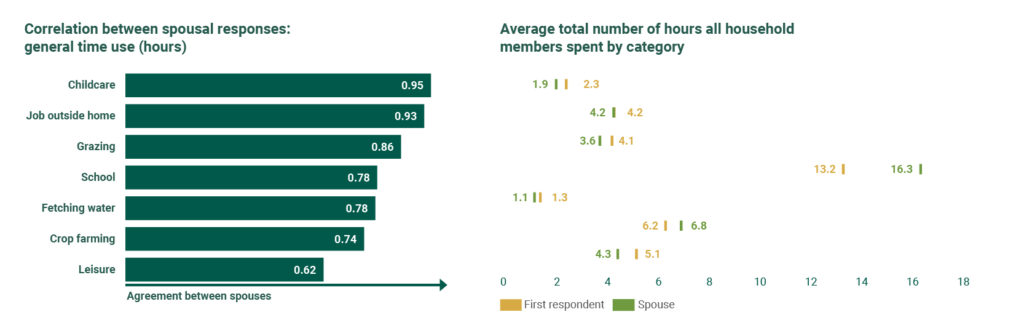
Male and female respondents broadly agreed on the division of labor within the household by gender of household members. We focus our description of intra-household gender-specific roles on the share of time spent by males and females within the household and checked whether men and women respondents generally agree on this proportion. This is presented in Figure 1 below, which organizes respondents’ perceptions by the proportion of hours household members of different genders spend on pre-specified activities within the household (p-values reflect tests of the null that there is no difference in responses across spouses). While male and female respondents differed in their reports of the time spent by gender of the household member, these differences were not significant for any time-use category other than crop farming. In this instance, the difference in perceived hours on task from the perspective of male and female respondents was statistically significant at the 5% level (as demarcated by the p-values next to each bar). In general, respondents of both genders reported that crop farming, grazing, school, and leisure were split nearly evenly by gender. Female household members, however, were reported to spend more time fetching water and engaging in childcare relative to male household members, and male household members were more likely to have a job outside the home.
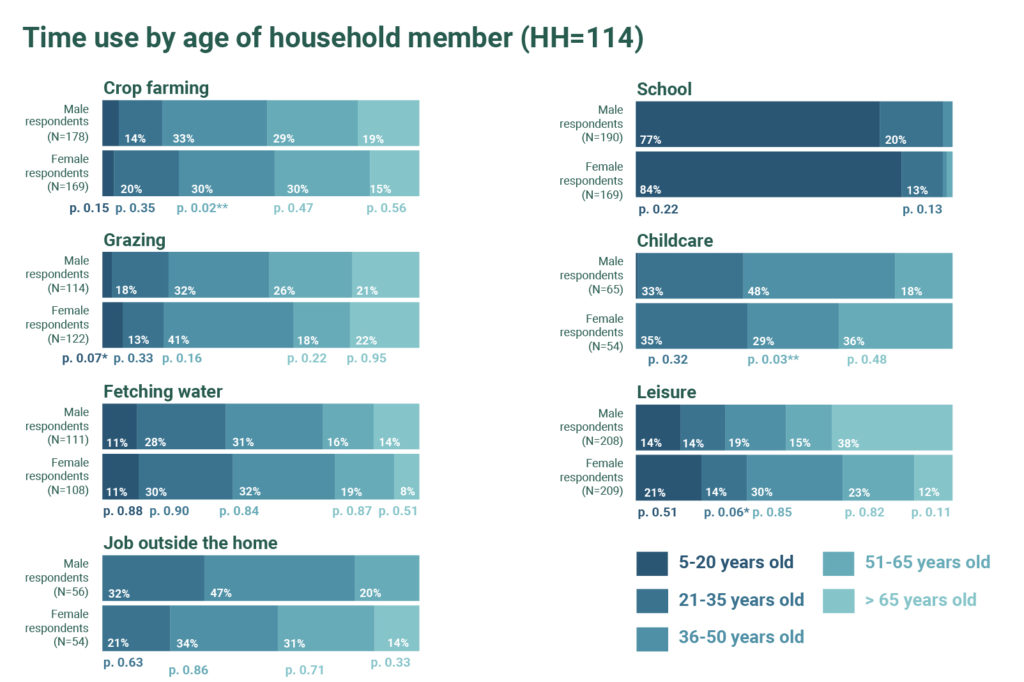
There was an overall alignment between male and female respondents on the reported activities of different age groups (Figure 2). The overwhelming majority of those in school were aged 5-20, while those aged 26-50 performed the bulk of income-generating labor, including crop farming, tending to grazing animals, and jobs outside the home, as well as tasks culturally associated with “women’s work” (fetching water and childcare). Leisure was fairly equally distributed across age groups.
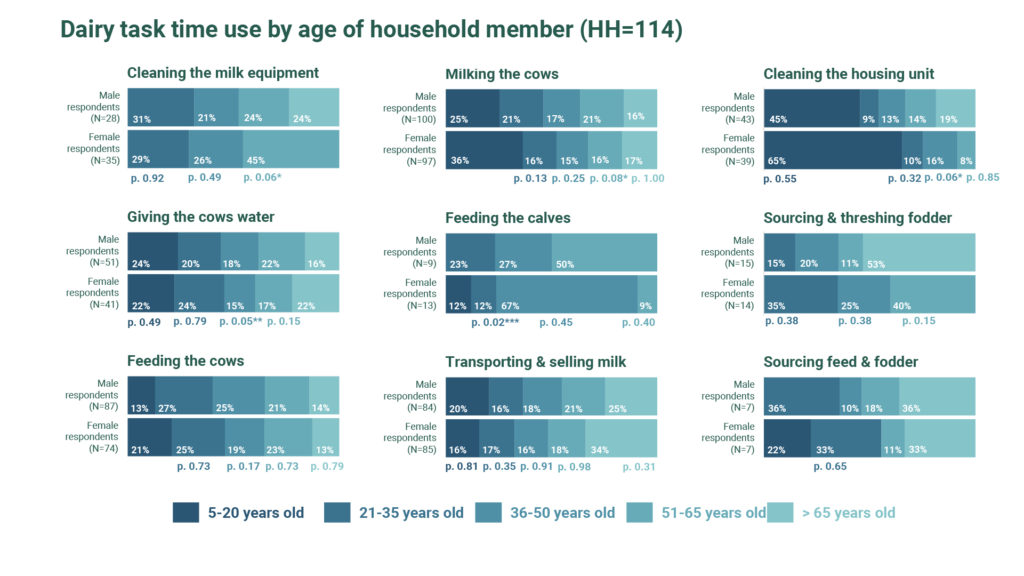
Of the 20 dairy tasks that each respondent was able to select from, nine were selected by respondents in our sample: cleaning the milking equipment, giving the cows water, feeding the cows, milking the cows, feeding the calves, transporting and selling milk, cleaning the housing unit, sourcing and threshing fodder, and sourcing feed and fodder. Figures 3 and 4 below applies the same analysis to these tasks as applied above to the responses on household time use: that is, Figure 3 analyzes the differences in male versus female respondents’ perceptions of household members’ dairy time-use by the gender of the household member, and Figure 4 analyzes this in terms of household member age group.
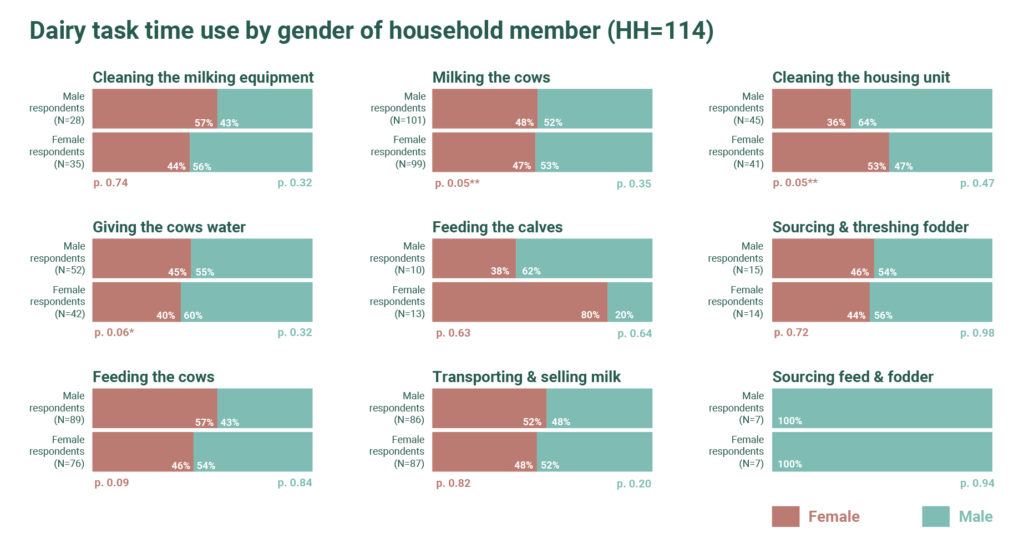
For most tasks, labor appears to be split fairly evenly by gender. A possible exception to this rule is feeding of calves, which female respondents assert is performed more by women than by men at a ratio of 4:1; men disagree on this, however, which is statistically significant at the 5% level, though the relatively low sample size makes it hard to put too much stock in this comparison. Further analysis could examine whether there is a difference based on a household’s production system. For example, in zero-grazing (or semi-zero-grazing) households, domestic tasks may account for a larger share of household labor, in turn skewing labor allocation toward the purview of women.
In addition to splitting labor by gender, dairy-related labor also appears to be distributed relatively evenly across age groups. The exceptions to this rule are “feeding the calves” and “cleaning the housing unit,” which according to female respondents – but not male respondents – is overwhelmingly performed by younger populations. Though difficult to say conclusively, a possible explanation for this difference in reporting is that female respondents may be more aware of how labor is divided on these tasks, which tend to be domestic in nature.
While on average there seems to be a great deal of agreement between spouses in our sample, this does not preclude the possibility of variation in the degree of agreement across households. Figure 5 below displays a measure of within household agreement by calculating the correlation coefficient in the vector of responses provided by women and men respondents in the same household. If, for example, on average, most husband and wife pairs agree on the time spent within the household on childcare, the correlation coefficient will be closer to 1. If they systematically disagree, the correlation coefficient will approach -1. If the correlation coefficient is close to zero, there is no clear agreement between husbands and wives within the same household on how tasks are distributed among household members. In our survey, there was a high degree of correlation between spousal responses for general time-use categories (i.e., crop farming, childcare, leisure, etc.).
Knowledge
Prior to measuring actual analytical skills and technical knowledge, we asked respondents to subjectively indicate which household members possessed knowledge in five categories: nutrition, artificial insemination, hygiene, disease, and feed. We then calculated the total percentage of individuals within a household perceived to have knowledge on a topic by gender (Figure 6) and age group (Figure 7).
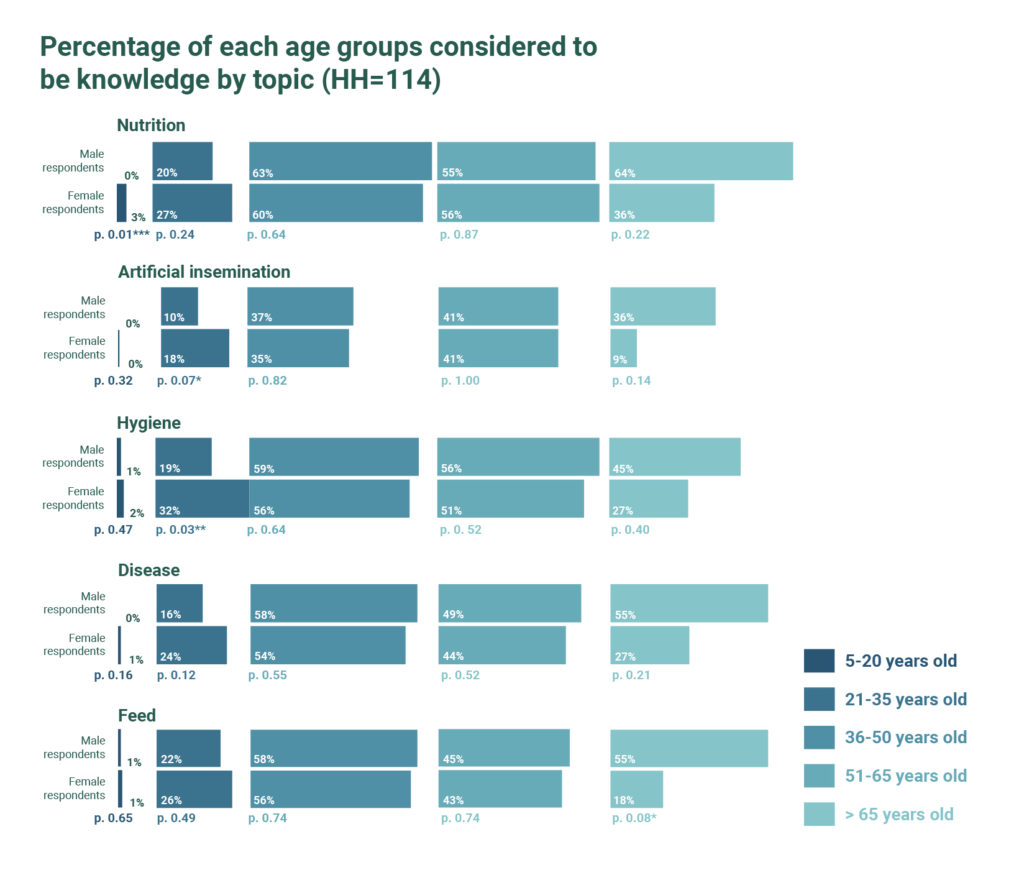
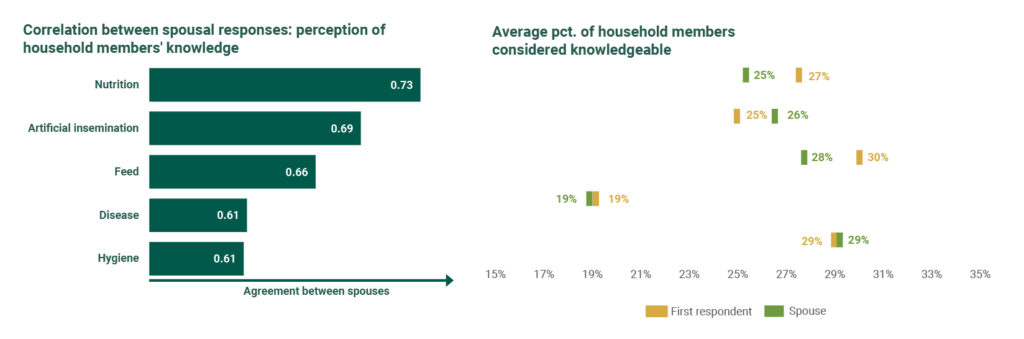
Across all categories, both male and female respondents perceived male household members to be more knowledgeable; there was broad intra-household agreement on knowledge perceptions as well (see Figure 8). Interestingly, male household members were judged to be especially knowledgeable in categories such as disease and artificial insemination; this was particularly true in the eyes of male respondents, who judged male household members to be at least twice as knowledgeable as women about these subjects. One hypothesis for this is that these subjects may carry a connotation of expertise due to their affiliation with actual professionals (i.e. veterinarians). By contrast, the perceived knowledge gap was a lot lower for other categories, such as nutrition and hygiene.
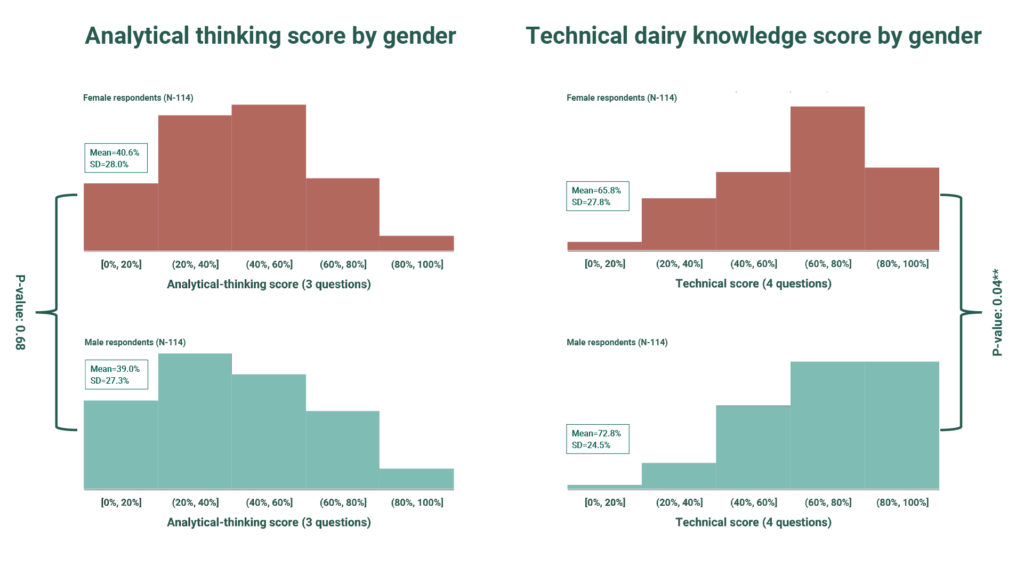
In fact, when tested, male respondents did perform significantly better than female respondents in terms of technical knowledge, with a mean score seven percentage points higher. That said, male respondents performed no better than female respondents on a test that used scenario-based questions to measure analytical thinking.
That said, two caveats must be considered in drawing conclusions from these results (shown in Figure 9): First, these results measure respondent knowledge rather than directly evaluating the knowledge of all household members. Second, the tests were brief and covered a broad array of subjects, making it impossible to evaluate whether the respondent may have deep knowledge on a particular topic. Both of these gaps suggest promising areas for future research in order to better understand the degree to which perceptions of knowledge match reality, rather than merely reflecting cultural biases; in reality, the answer may well be both, though additional empirical analysis is needed to make this claim.
Financial Agency, Intra-Household Decision-Making, and Trust
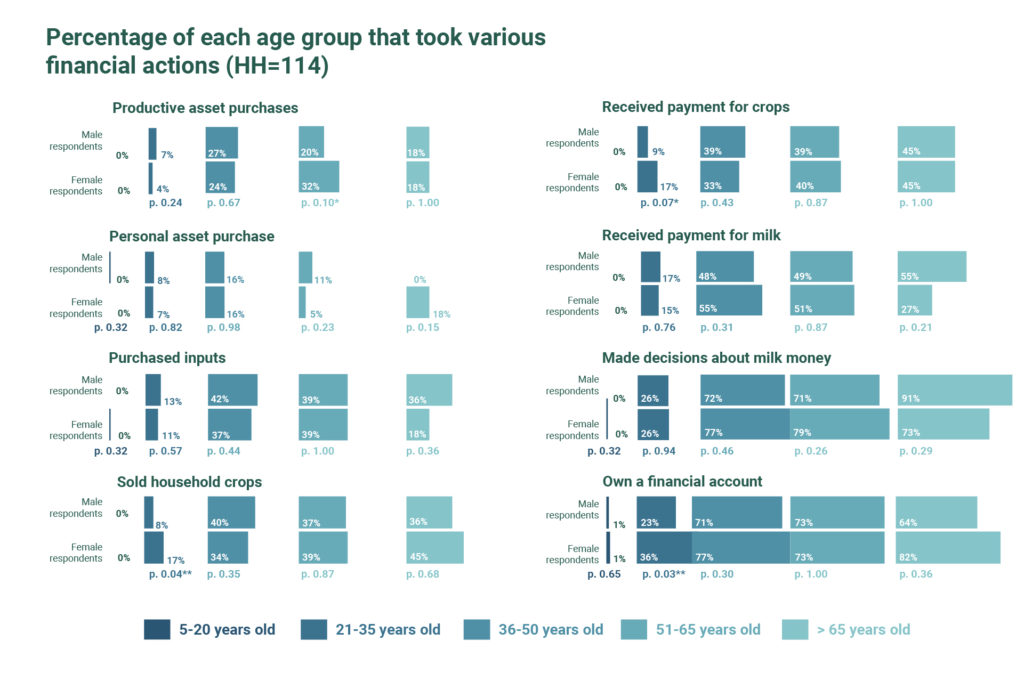
Respondents were asked a series of questions regarding their perceptions about who controlled money within the household: who in the household purchased productive assets, purchased personal assets, purchased inputs, sold household crops, received payments for crops, received payments for milk money, made decisions about spending milk money, and owned a financial account. Figures 10 and 11, respectively, analyze these results by gender and age of the household members.
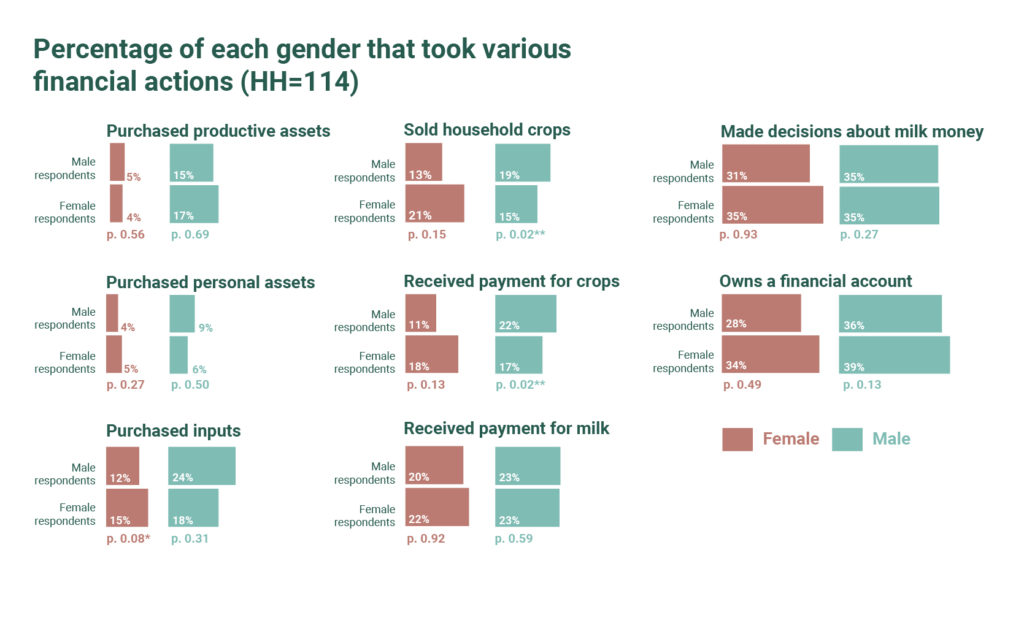
Very few household members were reported to have purchased personal assets; more – overwhelmingly men – purchased productive assets, according to both male and female respondents. Male and female respondents also agreed that payment for milk money and decisions about milk money were generally split evenly within the household. Both male and female respondents also reported that household members of both genders owned financial accounts (though men did so to a slightly higher degree).
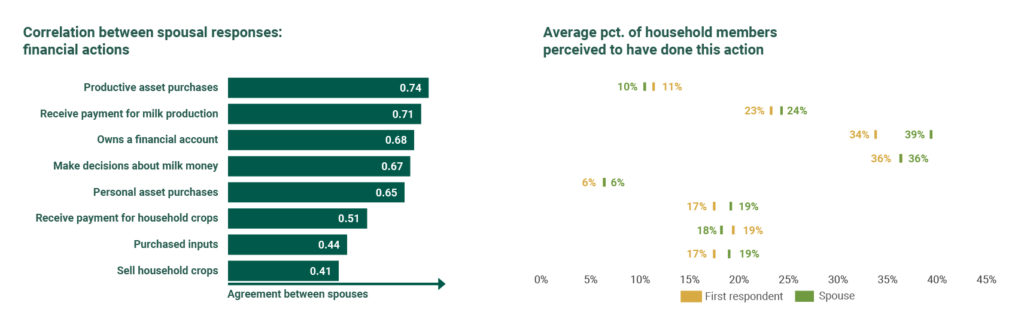
There was less agreement by respondent gender about crop farming. Male respondents reported that male household members played a larger role in selling crops, whereas female respondents reported the opposite. This same pattern was true regarding respondent perceptions of who received payment for crops. In both cases, the difference in the perception of different genders was statistically significant at the 5% level. Additionally, while respondents of both genders agreed that more male household members purchase inputs than female household members, male respondents reported the ratio to be 2:1, while female respondents reported this difference to be marginal; this disagreement was weakly statistically significant (at the 10% level). Within households, there was also comparatively more disagreement on the measures related to crop farming and associated income, as shown in Figure 12.
There are several potential explanations for the disagreement on this measure. One potential reason is there may be an internal lack of clarity within the household about who performed which category of tasks. This does not necessarily mean that individual tasks do not have a “clear” owner; alternatively, the divisions we at PxD made for the purposes of this survey may not correspond to household constructs around the division of finances. This suggests a possible area for future research: an open-ended survey consisting of structured interviews on this topic may yield interesting insights regarding financial accountability and power within the household.
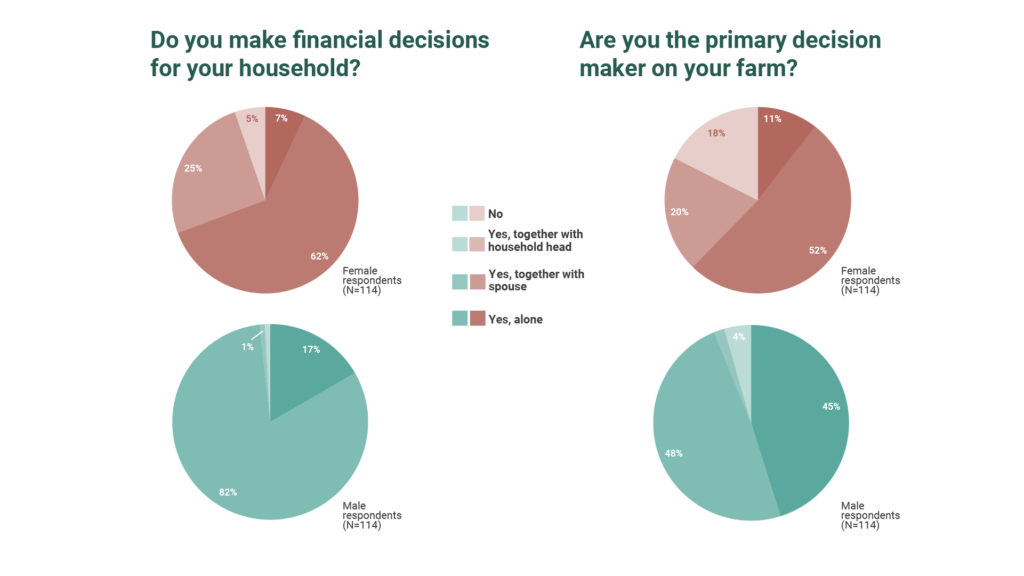
Moreover, the disagreement may reflect the fact that some tasks may be performed jointly (or in an alternating fashion) with other household members; this possibility need not be mutually exclusive with alternative divisions of labor within the household. The results in Figure 13 suggest this possibility. When asked who makes financial decisions about the farm, the majority of women (62%) and men (82%) said they made this decision together with their spouse; an additional 25% of women said they did so jointly with the household head. Even who the “primary” decision-maker was could be muddled, with 72% of women and 50% of men claiming to occupy this role jointly with either a spouse or household head.
These results are ambiguous regarding whether each decision is made jointly or whether men and women have different spheres of influence within the household (and financial discretion within those spheres). However, the Likert scale questions, in which respondents were asked to agree or disagree with a number of statements about intra-household decision-making suggest that many decisions are made jointly – or at least with a substantial discussion between household members. (Figure 14)
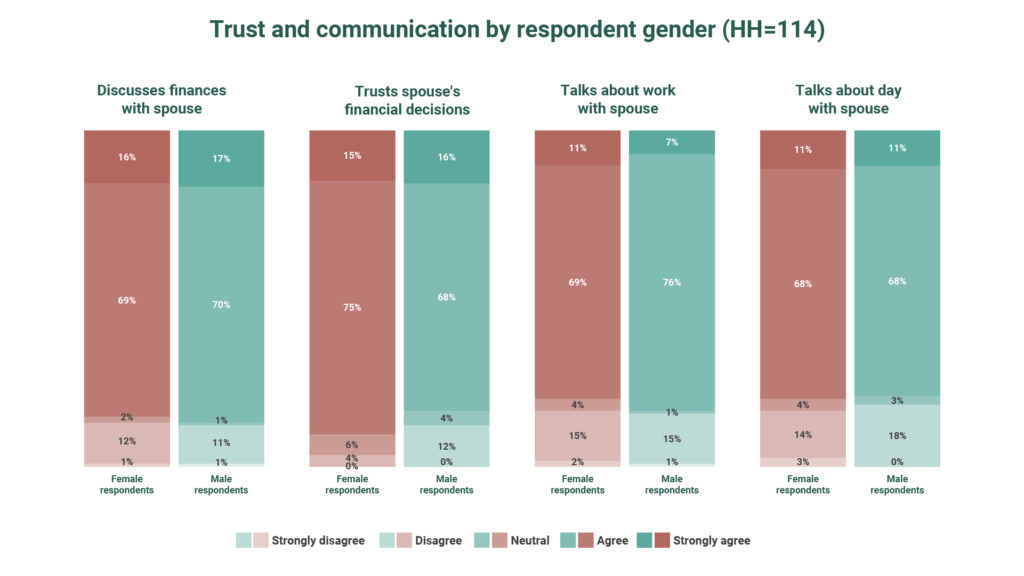
Eighty-five percent of female respondents and 87% of male respondents reported that they discussed finances with their spouse; moreover, 90% of female respondents and 84% of male respondents reported that they trusted their spouse’s financial decisions.
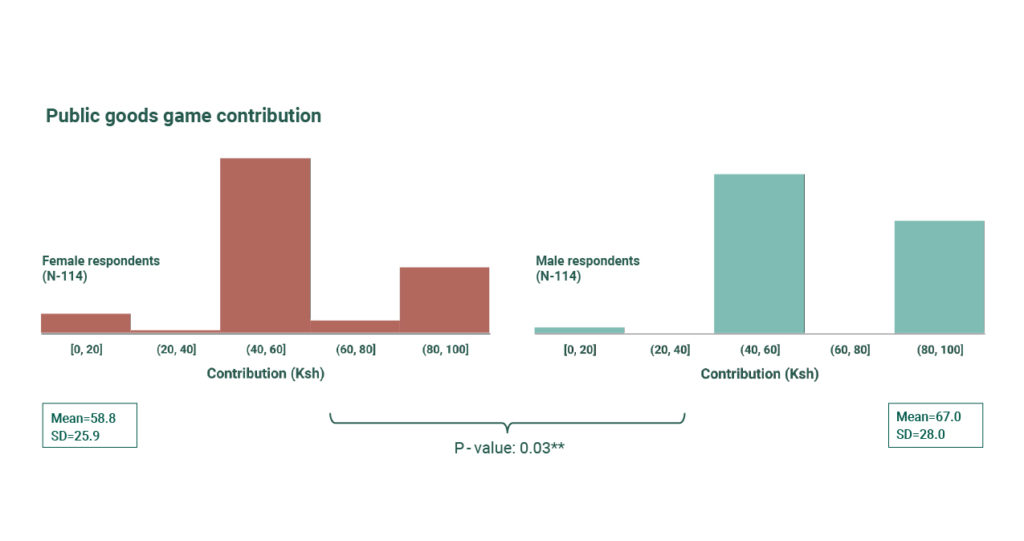
In order to empirically test these subjective responses, we also asked respondents to participate in a “public goods game,” in which they could choose to augment a portion of the financial incentive they earned for completing the survey (100 Ksh, or about 1USD) to a common account. Contributing a greater amount theoretically indicates a greater degree of cooperation with one’s spouse since the amount in the common account was split evenly between spouses after both completed the exercise, regardless of how much each spouse contributed individually. The results of this game suggest a moderate amount of trust, with contributions for both women and men clustering around the midpoint of the range between zero and the total possible contribution. Figure 15 displays the distribution of these respondents’ contributions. While male respondents contributed more on average (statistically significant at the 5% level), the plurality of respondents of both gender contributed a medium amount (i.e., 40-80 Ksh)
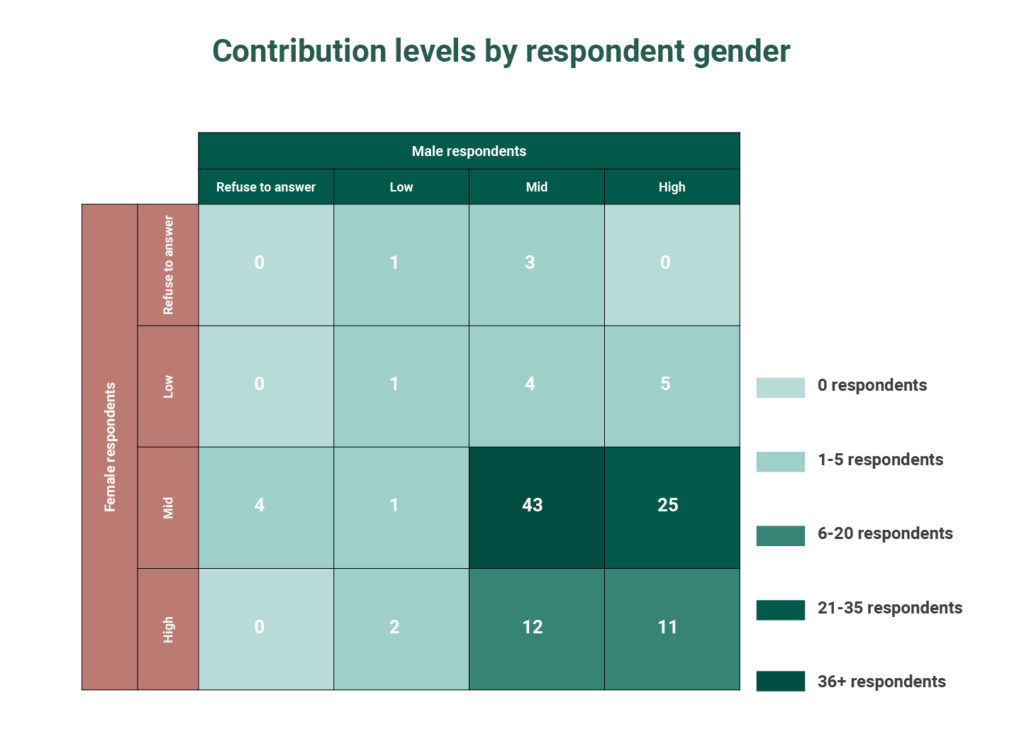
One way to empirically evaluate whether the public goods game in practice aligns with subjective cooperation in the household is to directly compare these results. First, we regressed the correlation coefficient between the spouse’s individual Likert responses – that is, the degree to which husband and wife agreed about their level of trust or communication – on the various contribution categories (limited the covariates to the bottom quadrant of Figure 16, to make sure each category reflects a sufficient sample of people to draw meaningful conclusions). The results of this regression are shown in Table 2. There was not a high correlation between these metrics, with none of the contribution categories predicting agreement between the spouses regarding the degree of cooperation.
The next stage of analysis was to compare directly the responses to the Likert scale questions on intra-household communication and trust to the public goods game contributions. To do so, we first split the sample by respondent gender and then ran ordered logit regressions separately for each sample (Table 3). In these regressions, a positive coefficient signifies that a member of a household in that specific contribution category is more likely to “strongly agree” with the statement. To make this concrete, the variable “female mid, male high” in the female sample is equal to one for a member of that population who contributed a medium amount (40-80 Ksh) and whose husband contributed a high amount (80-100 Ksh), and is equal to zero otherwise. A positive coefficient on this variable means that a respondent in this category is more likely to “strongly agree” with an affirmative statement on the Likert response; e.g. for the first regression in the table, she is more likely to say she often discusses finances with her spouse. While all the coefficients for the regressions on the male sample and about half of the coefficient for the regressions on the female sample are positive, none of the results in either sample are statistically significant.
Since the public goods game contributions do not align with subjective measures of intrahousehold cooperation, it is unclear whether respondents are less trusting in practice than they aspirationally report to be on the subjective questions, or whether the public goods game does not accurately measure intrahousehold trust. The answer may be a combination of the two or may vary by Likert category. This suggests an area for future research.
Next Steps
This information is valuable for informing the design and operation of a dairy service that empowers rather than further marginalizes female farmers. It bears mentioning that we will continue to monitor engagement by gender to validate the insights of this survey on an ongoing basis and to make sure that we continue to reach women farmers.
That said, there are a few points we can take away from this dataset –
and we can use it to identify areas for additional research:
- In general, women and men reported that they split labor related to crop farming and grazing, and both females and males reported going to school and pursuing leisure activities. Unsurprisingly, women reported spending more time fetching water and engaging in childcare relative to men, and men were more likely to have a job outside the home. Perhaps more surprisingly, most dairy tasks were split relatively evenly by gender. Further research could investigate the ways different production systems influence household division of labor: for example, since women generally take charge of more domestic tasks, in zero-grazing households is dairy-related labor more commonly performed by women?
- Both men and women perceived men to be more knowledgeable on all topics asked about (nutrition, hygiene, artificial insemination, and feed). One positive of digital advisory compared to traditional in-person systems is that both women and men are able to read the advice on their own, and thus may be less subjected to the influence (and doubts) of peers and other household members. However, this knowledge gap may have implications for marketing: if women are systematically viewed as less knowledgeable, men may find a service that aims to disrupt that balance in the household to be threatening. Additionally, the perceived knowledge gap may pose a barrier to adoption of recommendations by women if proposed without male buy-in and perceived to not know what they are talking about.
- The allocation of financial power in the household was far from clear-cut. A similar proportion of both genders received payment for and made decisions regarding milk money, and respondents of each gender disagreed as a group about which gender sold and received payment for crops. Additionally, the majority of respondents of both genders reported making financial decisions and being a “primary decision-maker” – either individually or jointly with a spouse or household head. Finally, both male and female respondents reported discussing finances with their spouse and trusting their spouse’s financial decisions. While this has positive implications for adoption of advice by both genders, it also suggests that many decisions are made jointly and buy-in from both spouses is necessary for implementation.
- The responses of respondents of both genders to the Likert scale questions suggest a high level of intra-household communication, trust, and cooperation, at least in the subjective opinions of respondents. Similarly, the vast majority of respondents of both genders contributed at least a medium amount (40 out of a possible 100 Ksh) to the common account in the public goods game. This has positive implications for adopting recommendations, which in many cases will require collective household buy-in. That said, there remains opportunity for a more granular understanding of intra-household cooperation. For example, how does it differ in households with more defined household and/or farming roles, or in households where one spouse is clearly knowledgeable? (While this dataset contains questions to this effect, the sample size is too small to draw meaningful conclusions about precise subsets of respondents.) Outside of this data, what impact do production systems (i.e. zero-grazing) and use of particular technologies (e.g. machinery such as chaff cutters or other equipment, such as durable water tanks) have on the level of intra-household cooperation?
While the effort to better understand our service users is ongoing and our efforts to improve content and delivery are constantly evolving, this data collection yielded meaningful insights and constituted a significant step towards inclusive product and service design that can be put to use in PxD’s Kenyan dairy service – and more broadly in programming across the region.

Stay Updated with Our Newsletter

Make an Impact Today