Dairy farmers in Kenya are being hit hard by climate change.
The country is seeing increased droughts, and, with dry spells projected to increase up to 27% in severity and heat waves likely to increase in duration by up to 30 days, climate change will continue to exacerbate the multitude of challenges farmers and their families face.
Access to water is key for dairy farmers and is a significant challenge in Kenya, especially in rural areas where the majority of the population lives. 76% of households in rural areas do not have piped water access, and spend an average of 3.5 hours per week fetching water (KIHBS 2018).
Continuous access to clean water is vital for dairy production, with an adult healthy dairy animal requiring about 75 liters of water daily, animals can die without water in 2-3 days. Increased herd movement to water sources impacts cow health and also imposes a substantial time burden, particularly for women and girls, with negative consequences such as dropping out of school.
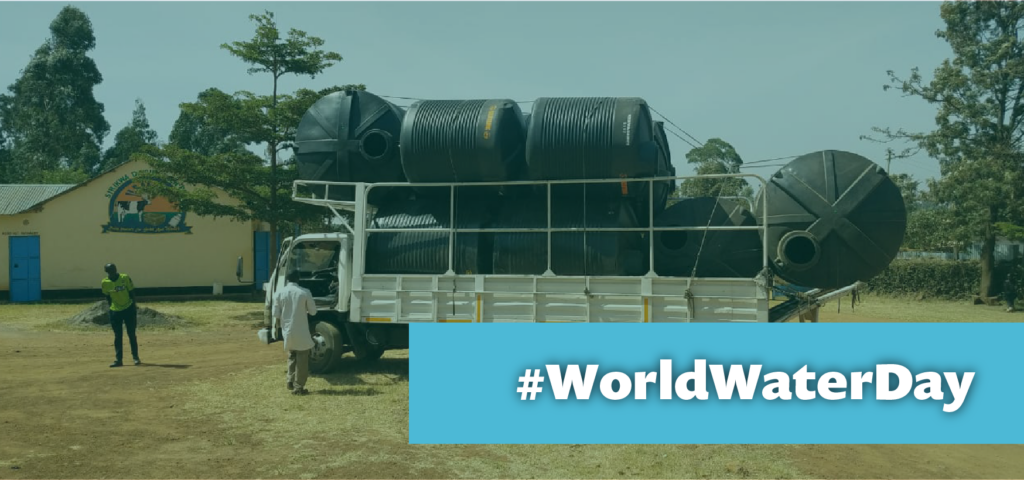
With changing weather patterns and unpredictable rainfall, rainwater harvesting can provide a sustainable source of water for agriculture and livestock production. This is particularly important in dairy farming, as water scarcity and poor-quality water can lead to decreased milk production and health issues in dairy animals. Large water tanks are an efficient method for storing harvested rainwater.
However, financial constraints limit smallholder farmers’ ability to invest in rainwater harvesting tanks for climate adaptation and improved dairy productivity. Lack of access to credit, limited financial resources, and competing household expenses are major barriers to investing in water storage tanks.
Against this backdrop, PxD’s program on Asset Collateralized Loans (ACLs) for water tanks presents innovative financing mechanisms to address water scarcity and liquidity bottlenecks to improve climate resilience and dairy productivity in developing countries.
How dairy ACL works
Water tanks pose a unique financing opportunity. They are large and difficult to move, and they retain their market value over time, meaning the assets themselves can serve as the collateral for a loan.
This removes the need for guarantors, which often poses a significant barrier to access to credit. Repayment is made automatically from the milk income earned through milk sales from the farmers throughout the month. If the farmer was to default on the loan, the tank could be resold at close to the original value.
About 1.8 million smallholder farmers depend on dairy farming for their livelihoods in Kenya but a bulk of them are unable to obtain loans from traditional lenders, such as banks, because they do not have the collateral or credit history required.
The ACL approach, therefore, has several advantages over traditional lending methods, which often require extensive paperwork and collateral that many smallholder farmers do not have.
Our Research Project
PxD has been implementing a two-year research project on ACLs for water tanks in collaboration with the University of Chicago’s Development Innovation Lab (DIL) and two dairy cooperatives (Lessos and Sirikwa Dairies) in Kenya’s Rift Valley region.
A previous study (Jack et al., 2019) demonstrated strong evidence that the ACL model for water tanks could improve farming and household health, as well as well-being outcomes among smallholder dairy farmers.
The study, conducted in partnership with the Nyala Savings and Credit Co-Operative Society (SACCO), randomly offered some farmers the opportunity to replace loans with high down payments and stringent guarantor requirements with loans collateralized by the asset itself.
At the end of the study, default rates were extremely low (less than 1%). Milk sales to the cooperative increased by 6-10%. And, because of the increased water supply within households, girls spent 19% less time fetching water, and school dropout for girls decreased by 85%.
This new study aims to evaluate the impact of ACLs for water tanks on economic and household outcomes among dairy farmers in Kenya. The main outcomes of interest include milk production and milk sales, loan performance, dairy farming practices, water use, time use (particularly for girls and women), household welfare, and well-being.
Delivering tanks to farmers
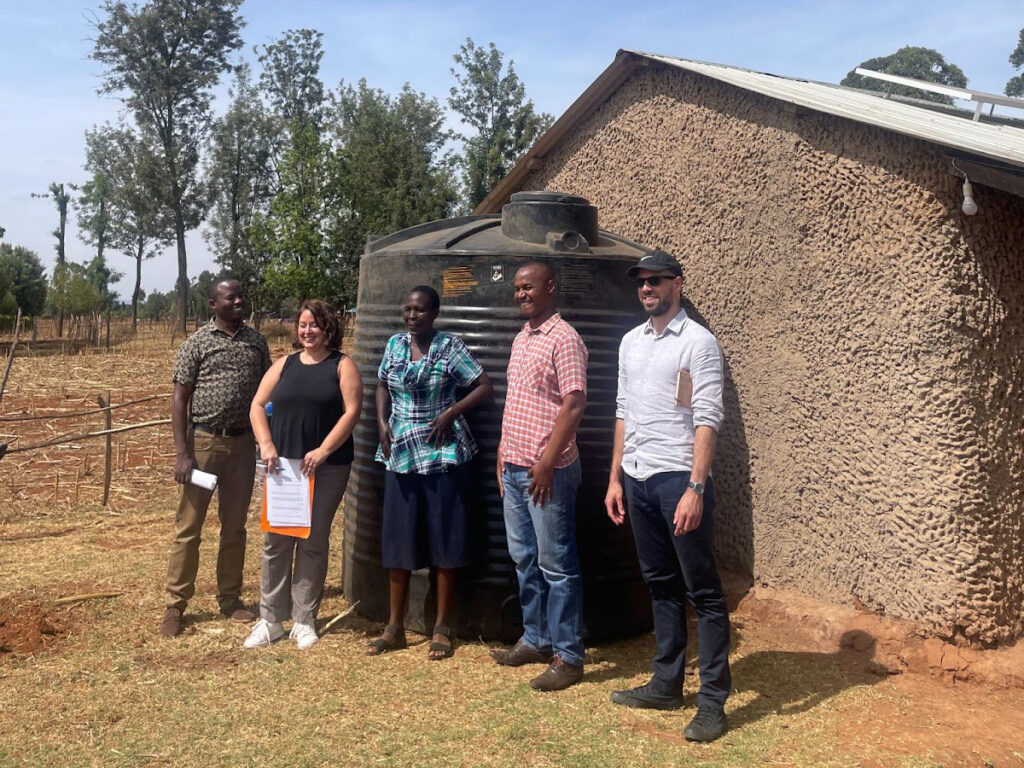
In partnership with the dairy cooperatives, PxD identified farmers that are eligible to receive the water tanks.
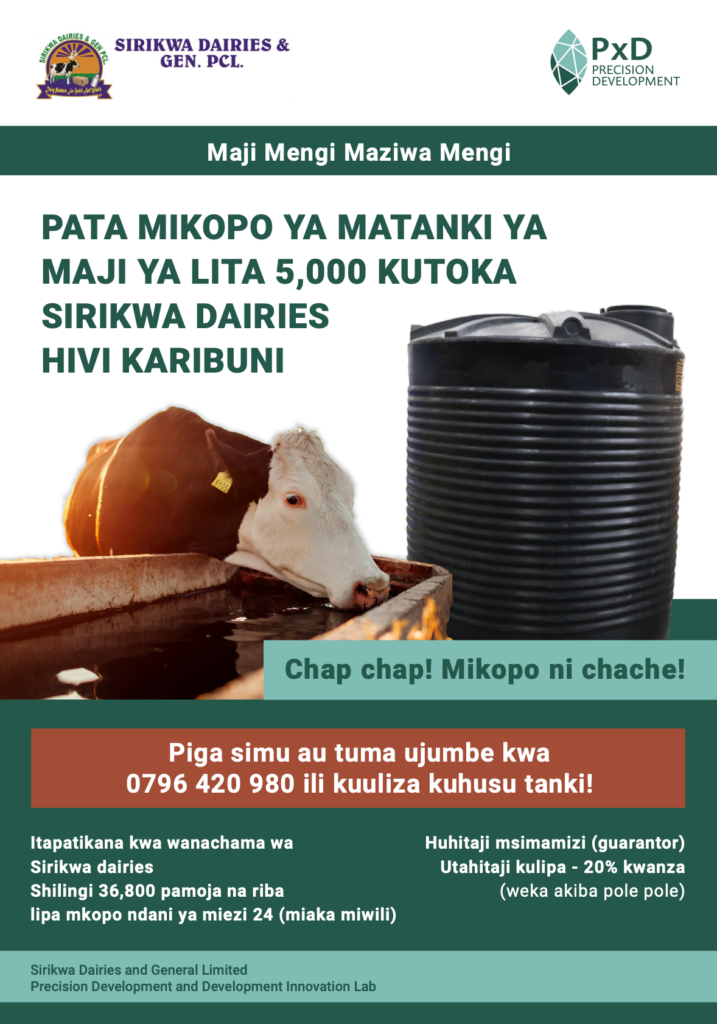
Eligible farmers need to pay an upfront deposit (currently 20%) to receive the tank, followed by monthly loan repayments over a two-year period. Farmers can choose between a 2500-liter or a 5000-liter tank depending on their needs. They receive the tanks at their doorstep for free, with a water tap that is ready to install. Starting from January 2023, PxD rolled out the tanks to a small group of 100 farmers. As of mid-March, 15 farmers had received the tank.
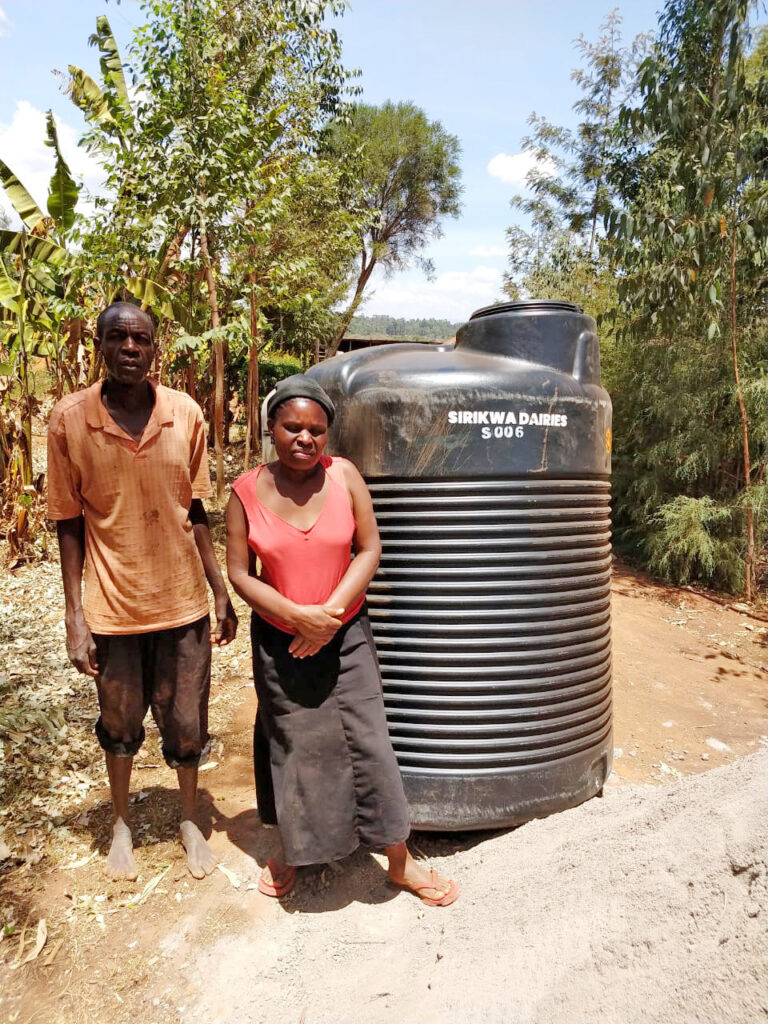
Farmers like Philip Too, a farmer from Sirikwa Dairy who has four dairy cows. Most of the people in his village rely on wells for their household water needs but unfortunately, they do not have sufficient water storage equipment. He is one of the few lucky farmers who are connected to electricity and thus he intends to fill his tank with water from a well within his farm using an electric water pump. With the tank, he hopes to have enough water to not only meet domestic needs for his family and livestock but also irrigate his small kitchen garden from which he expects to fetch some income by selling surplus vegetables to his neighbors.
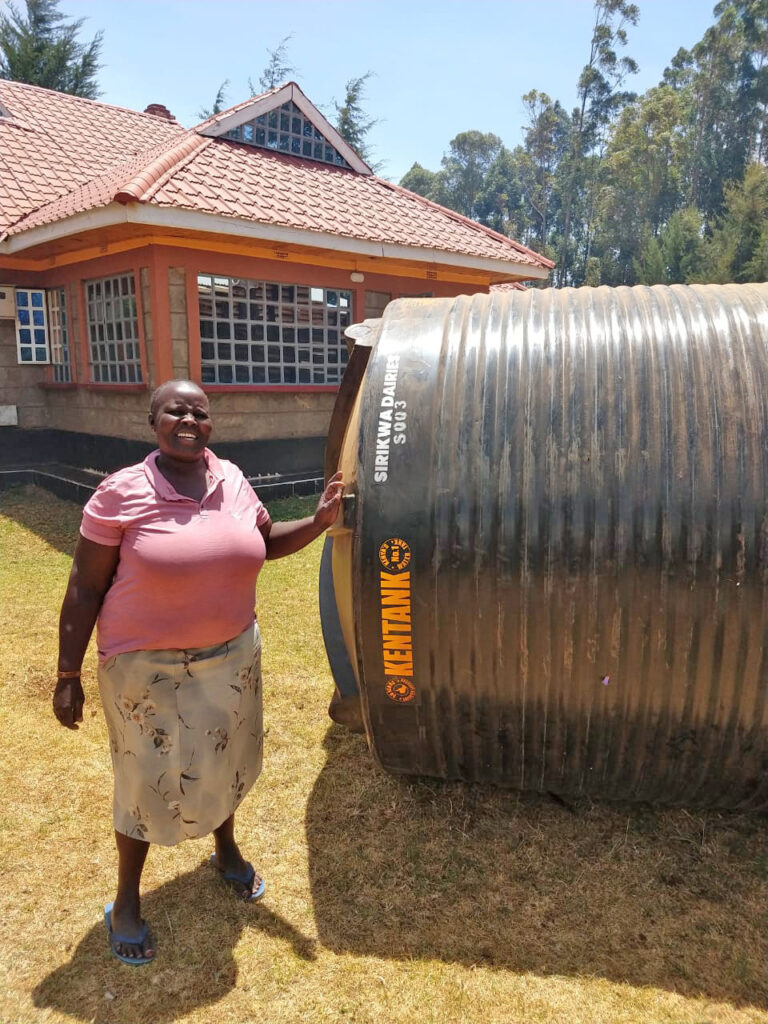
Esther Sambai, a farmer from Sirikwa dairy, decided to get a 5000-liter capacity tank instead of a 2500-liter tank to meet the needs of her household and neighbors. She said, “My well does not dry up and many people in my village get water from my household for free in the morning when I am at home. As you can see, we pump water directly from the well and therefore I decided to get a bigger tank so that I can store enough water for my family and neighbors. With a tank, my neighbors will be able to access water even when I am away. I will also use the tank to supply water to my animals.” Esther has a solar-powered pump but before the ACL for water tanks, she did not have a water storage tank. The ACL has enabled her to finance a tank easily.
Way Forward
In the coming months, we plan to roll out the tanks to additional farmers (with the goal of reaching 750 farmers in total).
From our early interactions, we have learned that several factors influence take-up including time of the year, competing financial needs such as school fees, and low trust in new financial products which could limit farmers’ take-up of the product.
To address this, we hope to pilot low-risk ways of making the ACLs for water tanks more accessible, such as by lowering the deposit or offering a grace period. We will continue to test similar loan flexibility mechanisms until we can define a product that is interesting, safe, and accessible to farmers across contexts and geographies.
PxD is also making its first foray in Kenya into using low-power radio communications for remote sensing by experimenting with water sensors in this study. These sensors will allow us to measure real-time water levels for dairy farmers so that we can correlate supply, consumption, and dairy output. We hope this paves the way for us to explore the use of other sensors (such as those that measure soil moisture or air quality) to improve farmers’ access to real-time information.
Our first few months of rolling out water tanks have given us insight into the potential for ACLs to enhance credit access for productive assets by reducing the financial burden and collateral obligation that smallholder farmers typically face.
We believe this initiative can have a profound impact on farmers and their families in different contexts struggling with access to water, and could be a path not only to increase profits for farmers and the welfare of their livestock, but improve the well-being of women and girls who are those being most impacted by climate change.
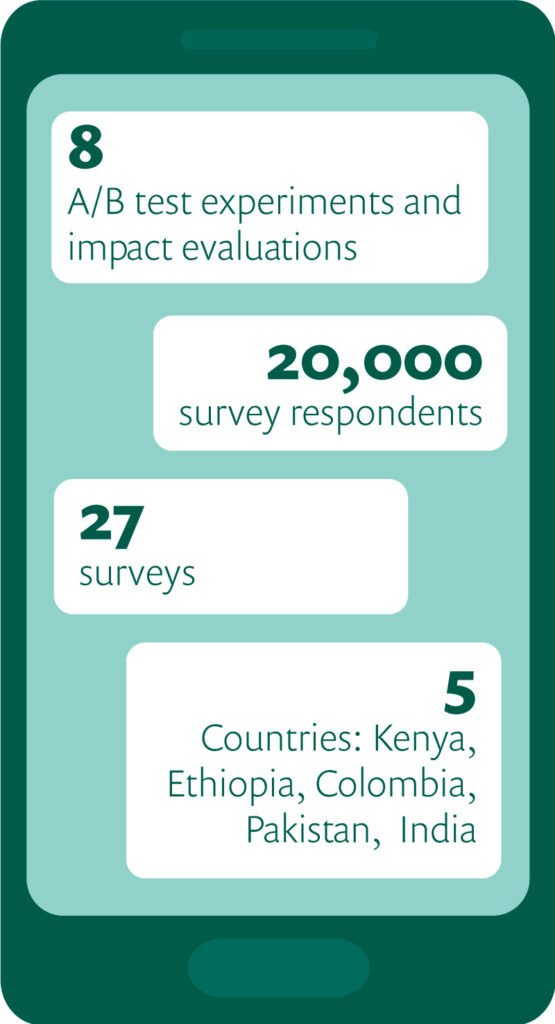
2022 was a tremendous leap forward for research at PxD. Our research and operations teams completed a total of eight A/B test experiments and impact evaluations. We collected data in person and over the phone from approximately 20,000 survey respondents in 27 distinct surveys that took place in Kenya, Ethiopia, Colombia, Pakistan, and three states in India.
We generated new insights to build future programming such as an SMS agro-dealer directory to reduce input market information frictions, built evidence-based proofs of concepts for innovative service design such as WhatsApp-based crowdsourcing chatbot and learned to leverage research partnerships for scalability with dairy cooperatives. We used research insights to shift and refine our approach and we are excited about further impact evidence from forthcoming analysis in 2023.
Devastating events in 2022 from drought in the Horn of Africa to the 100-year flood in Pakistan emphasize that climate change is one of the most urgent challenges facing our users. As such, we have intensified our research efforts to identify interventions that can improve smallholder livelihoods whilst incorporating climate adaptation and mitigation efforts into our existing services. We’ll continue this innovation research agenda in the coming year to explore high-value innovations to supplement our core digital agricultural advisory.
New insights to build future programming
Across a diverse portfolio of research projects, we have demonstrated the value of PxD’s services and contributed to an expanded knowledge base on digital agricultural extension. A particularly promising finding is establishing that digital tools can be effective in improving in-person extension services.
Performance goal reminders sent via SMS messages could increase extension volunteers’ performance: Through a large-scale randomized evaluation in Rwanda, we demonstrated that performance goal reminders sent via SMS messages – particularly goals that were ambitious but attainable – could improve community extension volunteers’ (known as Farmer Promoters – FPs) performance and therefore generate positive impacts on farmers’ outcomes. Sending goal reminders to FPs significantly increased the number of farmers trained by 3.1 percent, led to a significant 4.3 percent more training sessions being delivered, and increased farmers’ registration for subsidized inputs by 1.9 percent (statistically insignificant) over FPs who did not receive goal reminders. Given that the unit cost for each SMS is $0.006 and the average number of farmers assigned to each of the ~14,000 FPs across Rwanda is 190, the effect sizes of these messages are likely to be highly cost-effective.
The results of the Rwanda project support the expansion and replication of extension agent interventions in other settings targeting different populations in the future. In addition, these results point to areas for future research and development that could enhance the effectiveness of extension agent services. For example, we are interested in exploring how digital tools can be used to help extension agents set performance-increasing goals, direct them to farmers most in need, and extend information access to farmer populations that may not benefit from direct digital advisory services.
A digital directory of agro-dealers has the potential to increase the adoption of recommended inputs: In Kenya, we found evidence that farmers can benefit from the provision of an SMS agro-dealer directory by reducing input market information frictions. Our preliminary empirical findings suggest that – particularly for a directory that includes stock and price information about agro-dealers – access to this tool prompts farmers to refine their choice of agro-dealers before an in-person visit. Farmers in the treatment arm who had access to the agro-dealer directory and stock information contacted 21 percent more agro-dealers, but visited 4 percent fewer agro-dealers relative to the control group which did not have access to the tool. This suggests that farmers in this treatment arm used the contact information to call more agro-dealers before spending time and money to travel to the shops themselves.
Farmers given access to the agro-dealer directory were more likely to purchase PxD-recommended inputs and experienced fewer stockouts than those who didn’t have access to the directory. When pooling the two treatment arms, we observe that consistent with PxD’s advisory recommendations, treated farmers were 6 percent more likely than control farmers to use hermetic bags to store maize – a practice shown in rigorous studies like Ndegwa et al. (2016) to prevent post-harvest losses from pests. Farmers in the treatment arm with access to the directory but not stock info appeared to contact and visit agro-dealers at the same rate as the control group but then were 22 percent less likely than the control group to report facing an input shortage when they shopped (meaning they were more likely to find and purchase the product they were looking for).
Building on these promising findings, we hope to identify opportunities to further develop a scalable digital agro-dealer directory tool. Specifically, we are interested in exploring ways to onboard a large number of agro-dealers and update the stock information at a low cost.
Building proofs of concepts
Digital peer groups increase farmer interactions and potentially increase the adoption of recommended practices, but we need creative ways to form groups at a low cost: Various research projects aimed to demonstrate proof of concept for novel interventions that PxD was exploring for the first time. For example, we now have empirical evidence that an intervention in Kenya to organize farmers into groups and send them SMS nudges to communicate with each other was effective at increasing both engagement with PxD’s service and communication between group members. Treatment farmers who were organized into digital peer groups had higher interaction levels than their control group counterparts and were 43 percent more likely to meet with their group members on a farm than control farmers. Interacting with one’s group members on a farm was also associated with increased adoption and knowledge of recommended practices.
A gig-worker model for crowdsourcing agricultural field photos has the potential to generate real-time data on field conditions: We acquired institutional knowledge, both technical and regulatory, to build and operationalize crowdsourcing platforms to demonstrate the feasibility of crowdsourcing information from agro-dealers and farmers in Gujarat. In a pilot, we set up a WhatsApp chatbot, integrating a WhatsApp Business Account with our in-house user communications platform, Paddy, to guide users through a systematic inspection of a field for crop health issues and send reports back to PxD with their findings.
Eighteen of our recruited farmer agents consistently engaged with the program over 10 weeks, with a median of nine crop health reports per agent. The quality of field reports was high – approximately 94 percent of reports are usable. In total, we received 220 field reports with accurate GPS locations and usable photographs. Each of these reports costs INR 125 (USD 1.67), which is substantially below the cost of a 15-minute phone survey. This suggests that crowdsourced data could be a cost-effective method of collecting local data.
PxD aims to further build this knowledge to crowdsource various types of information and use it to improve future service offerings by customizing advisory to be more locally relevant and actionable.
Working with smallholder farmers in the fight against climate change
We are intensifying our efforts to provide information to smallholder farmers that will allow them to make informed decisions to reduce the risks that climate change presents to their livelihoods and to consider adopting practices that can actively reduce greenhouse gas emissions. We approach this work with the guiding principle of farmer welfare first: smallholder farmers cannot be expected to pay the price for climate change mitigation. Climate change-related advisory should directly support livelihood gains via improved agricultural output or renumeration .
PxD, in collaboration with the Institute for Governance and Sustainable Development (IGSD), worked to assess opportunities to benefit poor farming communities through their participation in climate mitigation activities and to direct tangible returns to participating smallholder communities.
The PxD-IGSD collaboration has focused on exploring four mitigation areas with most promise in agriculture: Carbon dioxide sequestration through enhanced rock weathering; Carbon dioxide sequestration with organic carbon storage in soils and plant biomass; Nitrous oxide mitigation through precision nutrient management; and Methane mitigation in dairy through improved livestock feeding practices.
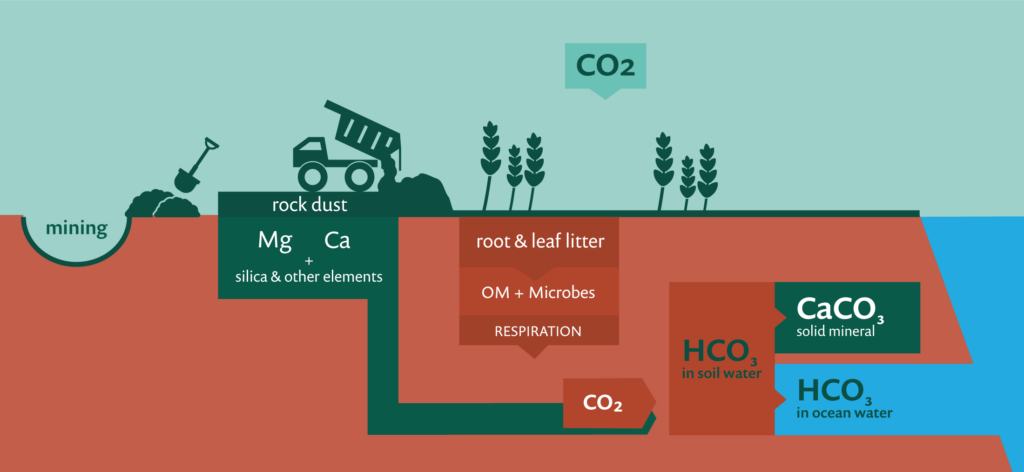
- Enhanced rock weathering (ERW), an emerging technology that permanently draws down carbon from the atmosphere and has the potential for agricultural co-benefits makes it an attractive mitigation strategy in the smallholder farmer context.
- There is evidence that conservation agriculture practices that many farmers are already familiar with – such as reduced tillage, the use of cover crops, and intercropping – promote the sequestration of organic carbon in soils.
- In terms of nitrous oxide emissions, simple decision support tools following the Site Specific Nutrient Management approach, i.e. Leaf Color Charts (LCC), have been shown to reduce nitrous oxide emissions from nitrogen fertilizer use as well as improve farmer outcomes.
- For methane, improving feeding practices that increase milk production and closing the dairy yield gap in the Global South per cow can lower the methane intensity of production and contribute to methane mitigation, as well as improving farmer livelihoods.
We’re excited to be on the cutting edge of exploring the potential of these climate change mitigation opportunities- like scoping a digital version of Leaf Color Charts to enable the tool to reach a wider scale and Advanced Market Commitments to incentivize R&D for enhanced rock weathering. Our research initiative with IGSD has enabled PxD to identify future activities within each opportunity area to advance climate change mitigation in the smallholder farmer context and we are actively pursuing partnership and funding opportunities to advance these activities.
Learning to leverage research partnerships for scalability
Partnerships have proven to be a critical pathway to increasing impact and scaling evidence-based programs across our project portfolio.
By collaboratively identifying and developing high-impact opportunities with dairy cooperatives in Kenya, PxD has identified a new partnership model in which PxD serves as a technical and analytical partner for innovating and testing service offerings for cooperatives, and builds cooperatives’ capabilities for generating greater impact at scale. We kicked off the partnerships with Lessos Dairy and Sirikwa Dairy by adapting an asset-collateralized loan product for water tanks which has been shown to dramatically increase access to water tanks among dairy farmers in a research study (Jack et al, 2022) and setting up an evaluation to measure its impact on economic and household outcomes.
In Gujarat, India we surmise that identifying low-cost and scalable approaches to crowdsource pest information will require leveraging local organizations and existing social networks for cost-efficient recruitment and training of agents.
To further explore opportunities to support women farmers in Gujarat, we successfully established partnerships that allow us to better understand the constraints women farmers face in engaging in economic activities and their access to information and other services. These partnerships allow us to design and implement group-based digital services to address those specific constraints.
Insights to shift and refine our approach
Our scoping activities allowed us to identify when a change in approach was needed or when interventions did not turn out to be as promising as we had hoped.
In the dairy sector in Kenya, we learned that existing market and coordination failures, such as credit constraints, need to be addressed to create an environment in which digital advisory can effectively improve smallholder dairy productivity.
In testing social learning mechanisms in Kenya, we did not find evidence that the designed intervention increased farmers’ knowledge or the likelihood of adopting recommended practices, despite finding that peer learning was effective at increasing both engagement with PxD’s service and communication between group members.
While subsequent qualitative interviews suggest that some farmers visited the farm fields of their peers and experimented with the recommended practices in a small portion of their plot, developing the digital peer group advisory further is likely to require a substantial investment in basic research to understand farmers’ social learning process and identify creative ways to reduce the relatively high costs associated with forming peer groups.
Finally, we learned to exercise caution in working with established women’s groups in Gujarat in a way that does not exacerbate local power dynamics within communities to ensure PxD’s services are designed in a sensitive way to promote the inclusion of marginalized groups that may face particularly challenging digital access gaps.
Looking forward to continue building our evidence base
In the coming year we are looking forward to continuing to build our evidence base with forthcoming insights on PxD’s impact on farmer welfare from several large-scale RCTs in India, Uganda, and Kenya.
For the impact evaluation of our largest service offered to date for rice farmers in India, endline data collection and analysis are expected following the second season of implementation in 2023. In addition to outcome data on farmers yields and profits, we’re excited to generate additional insights on scalable measurement options for detecting yield changes among rice farmers using remote sensing data.
In Uganda, our work with coffee farmers enabled PxD to explore several dimensions of digital advisory, including comparing a stand-alone digital advisory service to the provision of digital advisory as a complement to in-person training and studying social spillovers from our advisory services. An endline analysis of the effects of this program will be forthcoming in 2023.
We are also excited to generate initial insights on the impact of asset-collateralized loans for water tanks on economic and household outcomes among dairy farmers in Kenya. Using frequent administrative data from dairy cooperatives on milk production, we’ll be able to understand how improved access to water tanks helps farmers mitigate productivity shocks and domestic water shortages as farmers adapt to more dry spells from a changing climate.
In addition to evaluation research with rigorous RCTs, we look forward to building out our research innovation agenda in the coming year. We are exploring a variety of new, evidence-based high-value product innovations that can build on our agricultural impact for smallholder farmers, such as interventions to facilitate market linkages and access complementary financial services. We are committed to using rigorous evidence and deep user research to identify and prioritize which ideas to pursue.
We look forward to sharing new insights with you throughout 2023! If you’d like to learn more or partner with PxD on specific areas highlighted please get in touch!
From confronting cataclysmic floods in Pakistan, to biblical pest infestations in east Africa, smallholder farmers are on the frontline of an escalating climate crisis. Poor farmers, whose livelihoods disproportionately depend on rainfed agriculture, are particularly vulnerable. The destabilizing impacts of a changing climate will drive many millions of farming families deeper into poverty.
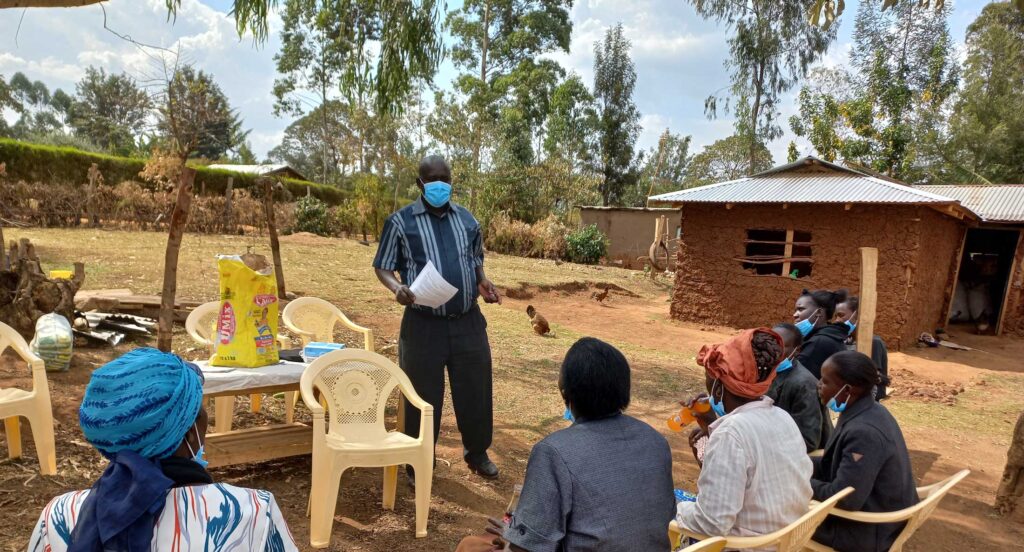
At PxD, we work with millions of farmers to give them the information they need to make more informed decisions about unfamiliar and escalating challenges. We are honored that our MoA-INFO service in Kenya was chosen by the Global Center for Adaptation (GCA) as a case study to highlight the utility of digital information for assisting smallholder farmers as they struggle to adapt to climate change.
In the video below, funded and produced by GCA, Kuboka Maureen, a member of our agronomic team based in Kakamega, is joined by MoA-INFO farmers to explain how the service has assisted Kenyan farmers to navigate climate-related threats.
Given existing poverty, dependence on agriculture for livelihoods, and lack of access to safety nets, poor smallholder families in low- and middle-income countries are particularly vulnerable to exogenous shocks. In March 2020, when the world shut down and told people to stay home to mitigate the public health impacts of COVID-19, many poor smallholder families were left reeling. In response to the growing humanitarian crisis, in April 2020 the International Fund for Agricultural Development (IFAD) launched a multi-donor COVID-19 Rural Poor Stimulus Facility (RPSF) to improve food security and resilience among poor rural people during the pandemic.
PxD was one of several RPSF grant recipients and interventions selected, all of which focused on either digital services, providing inputs or assets, access to markets, or targeting funds for rural financial services. In collaboration with the IFAD country teams and their government partners, PxD implemented three digital advisory services in Kenya, Nigeria, and Pakistan between August 2020 and September 2021 to provide digital extension services to approximately two million users. PxD reached 1.2 million farmers in Pakistan, 650,000 in Kenya, and 100,000 in Nigeria, surpassing the initiative’s target of 1.7 million farmers. This includes roughly 178,000 IFAD project beneficiaries across the three countries. These farmers received timely, relevant, and customized agricultural recommendations to improve their farm productivity directly via their mobile phones.
After successfully launching the initial digital services and delivering agricultural advice, IFAD and PxD conducted RPSF rapid assessments in late 2021 to assess farmer outcomes in all three countries. The surveys were designed to compare production, sales, income, food security, and resilience outcomes after the onset of COVID-19 but before the digital advisory intervention (the pre-intervention period) and after the intervention (the post-intervention period). We define resilience as the ability to cope with unexpected challenges and shocks, such as the ability to deal with drought/floods, pest invasions, and rising input prices. The final sample sizes for Kenya, Nigeria, and Pakistan were 400, 395, and 600, respectively. We stratified the samples by gender, youth status.Youth was defined as heads of households under 35, agro-ecological zone (AEZ) or state1Agro-ecological zones were used in Kenya and Pakistan; the survey covered seven (including unknown) and five AEZs, respectively. We stratified by seven states in Nigeria., and engagement level Kenya and Nigeria only, where we differentiate between high and low engaged users using the median number of messages or calls responded to. so we could analyze and compare outcomes by these subgroups. Within a country, we tested for statistical significance of crop, livestock, poultry, and agribusiness production and sales, as well as food security and income indicators between the pre-intervention and post-intervention period. The samples of farmers selected for the intervention and the surveys were randomly selected from our user bases of IFAD beneficiaries within each country, which may not be nationally representative. Moreover, this is a descriptive analysis, and we cannot infer whether PxD’s services had a causal impact on outcomes reported after the intervention because of the lack of an experimental design (there was no control group).
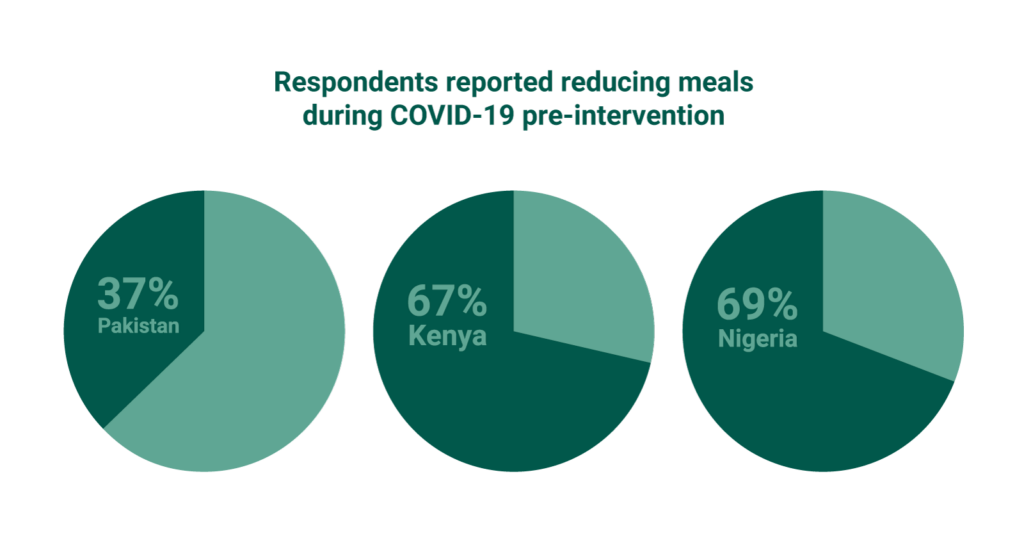
Farmer-reported outcomes during COVID-19, pre-intervention
Across all three countries, most respondents reported a loss or reduction in production, sales, number of meals, and resiliency during COVID-19 prior to PxD’s RPSF intervention (pre-intervention period). Respondents from Pakistan seemed to be the least affected by the onset of COVID-19, as fewer respondents reported reductions or losses, compared to Nigeria or Kenya. Moreover, almost half as many respondents reported reducing meals (37%) than in Kenya (67%) or Nigeria (69%). For all indicators except food security, respondents from Kenya reported the worst outcomes, including over 98% who reported lost or reduced production during COVID-19. There was also a wide disparity between the percentage of respondents reporting selling assets across the three countries. Almost two-thirds (65%) of respondents in Kenya reported selling assets because of COVID-19, whereas less than 10% of respondents in Nigeria reported the same.
We also disaggregated production and sales outcomes by specific types of farming that farmers engage in, namely: crop growing, livestock rearing, poultry raising, and agribusiness activities. We find that agribusiness production and sales suffered the most in Pakistan when compared to crop, livestock, and poultry. This finding could be attributed to COVID-19 restrictions which limited the ability to engage in business activities. However, in Kenya and Nigeria, farmers reported larger reductions in crop production and sales compared to livestock, poultry, or agribusiness.
While respondents in Kenya overall seemed to fare the worst in the pre-intervention period, Kenyan women suffered disproportionately more. For example, all Kenyan women reported a reduction or loss of production during the pandemic, and women reported higher reductions than men for all other indicators. We don’t see the same clear pattern in Nigeria or Pakistan, although more women from all three countries reported worse food security outcomes than men. This could in part be due to cultural expectations of women eating last and in small portions, compared to men in the same household.
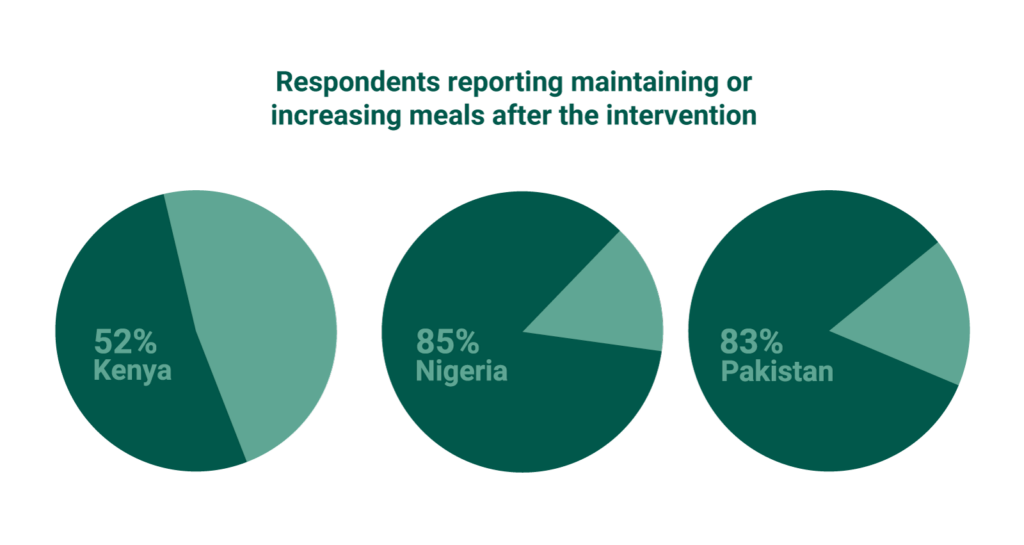
… and post-intervention
After the RPSF intervention concluded in late 2021, during a lull in the COVID-19 pandemic between the Delta and Omicron waves, we observed encouraging evidence of improved farmer resilience. Respondents in all three countries indicated that conditions had improved relative to the early phase of the pandemic, at the onset of COVID-19 but before the digital advisory intervention (the pre-intervention period), however, some fared better than others. For example, Nigerian respondents reported maintaining or improving production, sales, income, meals eaten, resilience, and asset indicators at higher rates than those in Kenya and Pakistan. Considering the poor conditions they reported during COVID-19, we take this as a sign that Nigerian respondents may have recovered from the pandemic more quickly than their counterparts in Kenya and Pakistan. Conversely, in addition to suffering the worst outcomes in the pre-intervention period, Kenyan respondents indicated that they maintained or improved outcomes the least in the post-intervention period. Only about half of Kenyan respondents reported production and meals were maintained or increased, and less than half reported maintaining or increasing sales, income, resiliency, and assets. Only 25.5% of Kenyan respondents reported income stayed the same or improved, highlighting that Kenyan farmers have struggled significantly in recovering from the pandemic, even after receiving the intervention.
Kenya experienced severe drought during the long rains 2021 season (February-March to June-August depending on location) while the RPSF intervention was underway and during the collection of this data, which likely contributed to the poor outcomes reported after the RPSF intervention. For example, many farmers reported failed crops rendering it impossible to follow the customized digital advisory of the intervention, and to harvest and sell their crop. This is corroborated by reports estimating reduced crop production of up to 70% in Kenya during the drought2Oxfam International, 2022 https://www.oxfam.org/en/press-releases/many-28-million-people-across-east-africa-risk-extreme-hunger-if-rains-fail-again.
Disaggregating the results by type of farming activity, we find that Kenyan and Pakistani farmers reported production and sales reductions in agribusiness the most, even after the RPSF intervention. Because COVID-19 restrictions imposed by the government persisted during the intervention and survey period, we suspect that these restrictions played a role in farmers’ ability to engage in agribusiness, resulting in lower production and sales than other farm activities. In Nigeria in the post-intervention period, farmers reported reductions in production and sales for crop farming more than the other surveyed farm activities, suggesting that even though there were improvements to production and sales after the intervention, farmers’ crop yields suffered the most, relative to their livestock, poultry, and agribusiness activities.
In Pakistan, we observe better outcomes than in Kenya, although slightly less than half (48%) of respondents indicated they maintained or improved their income after RPSF, and only slightly more than half (57%) reported maintaining or improving their sales. Greater than expected wheat yields might have contributed to the better outcomes observed in Pakistan. But while these figures are somewhat encouraging and indicate that some Pakistani farmers were able to recover from COVID-19-related shocks, it also indicates that a significant share of farmers has not recovered. This could be because of the lingering effects of COVID-19 such as global trade shocks and new variants disrupting economic activity via additional lockdowns.
Similar to the outcomes reported during COVID-19, Kenyan women respondents indicated they maintained or improved outcomes less than their male counterparts after the intervention, across all indicators except assets. Only 17.3% of women reported maintaining or improving their income after RPSF, which is almost half the proportion for men, highlighting the predicament of women in Kenya in the face of COVID-19 and drought-related shocks. In Pakistan, while overall outcomes were better, we still note women reported maintaining or improving production, sales, income, and meals at lower rates than men. In Nigeria, a higher proportion of women actually reported maintaining or improving income, meals, and resiliency, and for the other indicators, women reported maintaining and improving at similar rates to Nigerian men. However, we also found evidence that women were disproportionately affected in the livestock sector; Nigerian women were more likely to report reductions in livestock production and sales after RPSF, compared to their male counterparts. Across all three countries, women reported faring worse than men in maintaining or increasing sales.
We also disaggregated the post-intervention RPSF results by farmers’ level of engagement with the PxD service, where we defined highly engaged users as having picked up or responded to more than the median number of calls (Nigeria) or SMS messages (Kenya)3We did not disaggregate by level of engagement in Pakistan.. In Kenya, we did not see any clear patterns by engagement level. However, in Nigeria, we found that highly engaged users (who picked up more than seven calls) reported maintaining or improving production, sales, and income at a higher rate than lower engaged users. This result provides suggestive evidence to our theory of change that users who more actively engage with our services may implement more of (or implement better) our recommendations, leading to improved outcomes.
It was challenging to draw clear conclusions from the data at the level of agro-ecological zone and state, due to the small number of respondents per zone or state. For example, in Kenya, there is some evidence that households from the upper highlands (UH) AEZ fared better than respondents in other zones. This may be because the UH zone was less affected by severe drought than other more arid regions in the country. In Nigeria, respondents in Katsina fared worse than the other states, reporting the highest level of reductions in most production, sales, food security, and resiliency measures. We suspect that local terrorism and banditry in the state played a role in the poor outcomes reported there. Meanwhile, respondents in the Nigerian state of Jigawa reported faring the best, which may be because widespread telecommunication shutdowns that plagued the country during the grant period were avoided, and the state is relatively peaceful compared to others in the north.
While the initial COVID-19 shock occurred in early 2020, the results of the surveys suggest that there are strong lingering negative effects in all three countries (as well as other severe shocks such as extreme weather events and terrorism) and more direct support is needed to return smallholder farmers to their pre-COVID-19 state. While this analysis does not estimate the causal impact of PxD services, we plan to use the data from this analysis to improve our services to more effectively meet farmers’ needs. In Kenya, we hope to specifically address weather-related shocks such as severe drought. Weather-related services are already being explored in Pakistan and India and learnings from these pilots might also be applicable in Kenya. Based on the evidence that women found it more difficult to cope and recover from COVID-19, we hope to develop women-targeted interventions designed to reach more women users or develop content tailored to women’s needs. This will build on gender-focused service experimentation we have undertaken such as providing messages with a female narrator and nudges encouraging spouses to share PxD advisory with each other, as well as implementation of advisories focused on female-dominated value chains such as kitchen gardens, dairy, and livestock.
Since the conclusion of the intervention and endline survey, farmers’ situations have become even direr. Experts warn of rising food shortages and hunger due to high global inflation and supply chain disruptions caused by the war in Ukraine. The World Bank estimates that the Agricultural Price Index is 14% higher as of this June compared to January and 94% of low-income countries are experiencing food price inflation greater than 5%. The already looming food crisis is expected to be exacerbated by a sharp increase in fertilizer prices, largely driven by the war in Ukraine, as Russia and its ally Belarus produce 40% of the world’s supply of potash, and Russia and Ukraine together export 28% of nitrogen and phosphorus-based fertilizers. Within this context and amid the backdrop of the ongoing pandemic, the need for strong support for poor smallholder families is urgent.
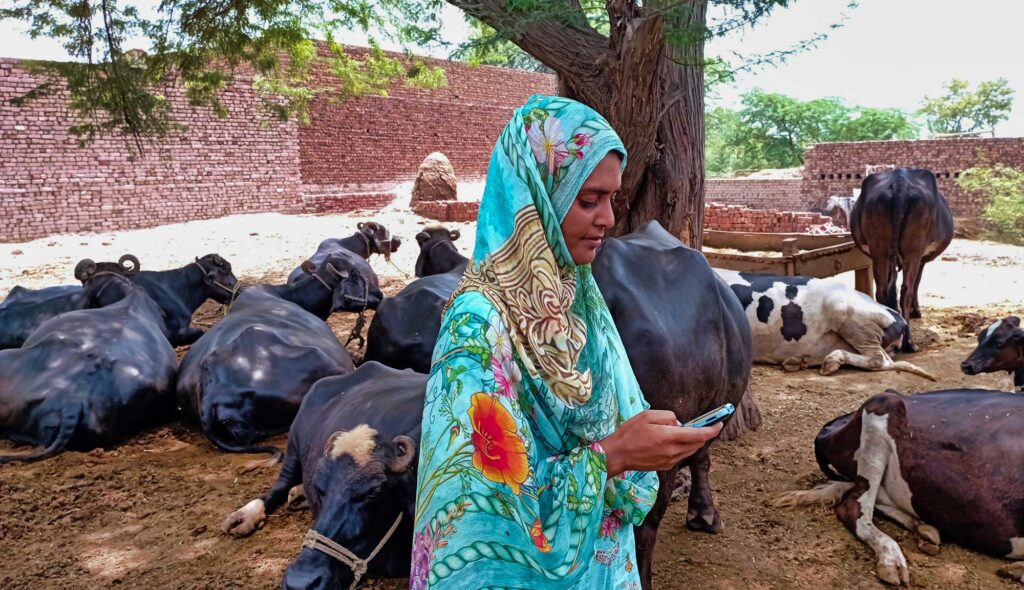
Women play important roles in smallholder dairy production. As PxD prepares to roll out a dairy advisory initiative in Kenya, we conducted a gender survey to better understand the division of labor within households. In this post, the second of a two-part series, Sam Strimling, Research Associate, presents an analysis of the results. The first post laid out the importance of understanding the specific needs of women in designing effective service delivery for women.
In many smallholder households, labor relating to the tending of livestock – particularly dairy animal husbandry and dairy production – is derived disproportionately from women. This culturally entrenched division of labor has direct implications for PxD as we expand into supporting dairy farming activities and seek to target our digital advisory services appropriately.
There is a plethora of evidence – much of it detailed in the excellent book, Invisible Women, by Caroline Criado Pérez – of service providers who failed to understand women’s specific needs and preferences and thus designed inferior products. Providers of digital advisory services are no exception to this disappointing phenomenon.
As PxD prepares to roll out a dairy advisory initiative in Kenya, we considered it a top priority to conduct a gender survey to better understand the roles played by each household member with a focus on tasks performed, decision-making, and financial agency. The results of this survey will be used to inform the dairy content we are developing as part of an upcoming randomized controlled trial (RCT) we are implementing in partnership with several dairy cooperatives across different regions in Kenya. We will use the results of the survey to inform the type of content we write, as well as how and to whom we deliver it.
As detailed in a previous blog post about the survey, the PxD Kenya team used a novel and rich dataset to inform survey design. In addition to gaining insights into the roles played by different members of the household, we also sought to better understand the technical and analytical abilities of each respondent, as well as perceived technical knowledge for each household member. Finally, we used methods from behavioral economics to empirically evaluate trust within the household.
Survey Structure
We started with a total sample of 600 households randomly selected from two dairy cooperatives, in the Rift Valley and Eastern regions. The sample was stratified by geography, milk sales to the dairy, and deductions for purchases from the dairy-affiliated agrovet (in which farmers are able to purchase animal medicines and farming inputs using income from milk).
We called 464 unique respondents, of whom 357 answered at least one call. Respondents who lived with or made decisions with their spouses were asked to provide contact information. Single respondents – many of whom were widows or widowers – were encouraged to complete the survey, but were not asked a series of subjective questions about the degree to which they made decisions or discussed activities with their spouses. Single respondents were also not asked to participate in the public goods game. In total, 114 spousal pairs completed the full survey. These spouses, and their respective households, will be the focus of this post. The demographics of the survey respondents and their households are shown in the table below.
Intra-household dairy roles. At the start of the survey, each respondent was asked to list the members of the household above the age of five, and state their age, gender, and education. The survey enumerators used tablets to record responses that allowed them to capture this information to be used later in the survey. Respondents were then asked to select from this list to indicate which member(s) of the household:
- Practiced crop farming, grazing, fetching water, wage employment [Respondents were specifically asked if they held “a job outside the home.”], schoolwork, childcare, and/or leisure in any given week. Respondents were also asked to indicate the number of hours each selected household member spent on each task in a typical day.
- Practiced various dairy tasks, selected from a list of tasks generated by our Staff Dairy Livestock Expert. For each task selected, respondents were asked to indicate which household member took primary responsibility, and how many minutes this individual typically spent on that task per day. This is the only household roster question for which the respondent was asked to select a single respondent rather than having the option to select multiple members.
- Were knowledgeable about nutrition, artificial insemination, hygiene, disease, and feed and fodder. The respondent was also asked to rank the selected household members in terms of their knowledge on that particular topic.
- Had taken various financial actions, including purchased a personal asset, purchased a productive asset, sold crops on behalf of the household, received payment for crops on behalf of the household, received payment for milk production, and made decisions about spending dairy income.
Analytical ability and dairy knowledge. Respondents were asked to answer a series of scenario-based analytical questions as well as questions to assess technical dairy knowledge on a broad range of topics. We then calculated the percentage of analytical and technical questions the respondent answered correctly.
Subjective assessment of financial agency and cooperation. Respondents were also asked to provide information on their personal knowledge and feelings of financial agency. To assess financial agency, respondents were asked to indicate using a Likert scale the degree to which they discussed finances with their spouse, trusted their spouse’s financial decisions, talked with their spouses about agricultural work, and talked with their spouse about their day generally.
Intra-household cooperation – the public goods game. Finally, all respondents who completed the survey were awarded 100 Ksh (approximately $1) in airtime, and – if their corresponding spouse had also completed the survey – they were invited to increase their earnings by contributing some portion of their earnings into a common account with their spouse. Since the amount contributed to this common account was doubled and then split evenly, the respondent’s contribution could be interpreted as an empirical measurement of cooperation with their spouse.
Information asymmetry. For the 115 households in which we collected information from both spouses, we were able to calculate the degree of coherence in their responses in terms of the intra-household (inter-spousal) correlation coefficient.
General Time Use & Dairy Tasks
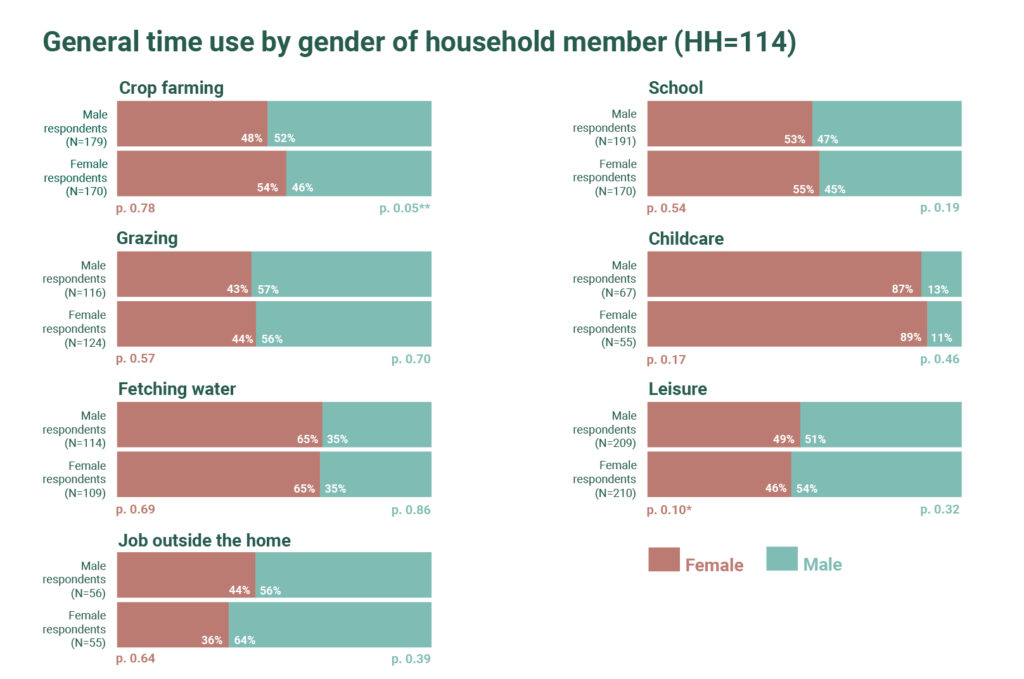
Male and female respondents broadly agreed on the division of labor within the household by gender of household members. We focus our description of intra-household gender-specific roles on the share of time spent by males and females within the household and checked whether men and women respondents generally agree on this proportion. This is presented in Figure 1 below, which organizes respondents’ perceptions by the proportion of hours household members of different genders spend on pre-specified activities within the household (p-values reflect tests of the null that there is no difference in responses across spouses). While male and female respondents differed in their reports of the time spent by gender of the household member, these differences were not significant for any time-use category other than crop farming. In this instance, the difference in perceived hours on task from the perspective of male and female respondents was statistically significant at the 5% level (as demarcated by the p-values next to each bar). In general, respondents of both genders reported that crop farming, grazing, school, and leisure were split nearly evenly by gender. Female household members, however, were reported to spend more time fetching water and engaging in childcare relative to male household members, and male household members were more likely to have a job outside the home.
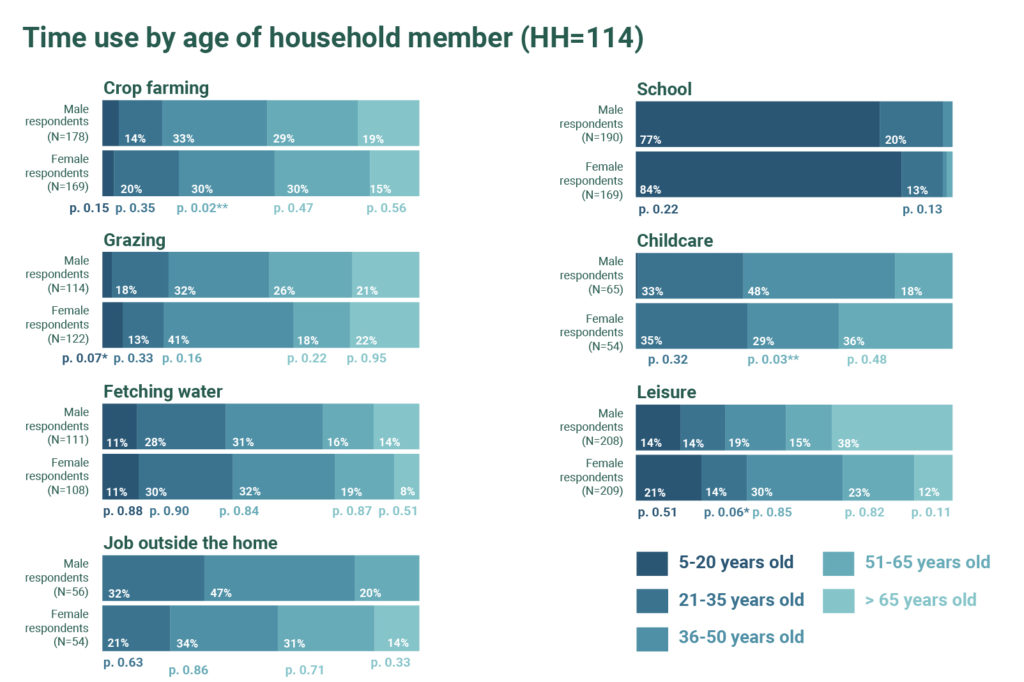
There was an overall alignment between male and female respondents on the reported activities of different age groups (Figure 2). The overwhelming majority of those in school were aged 5-20, while those aged 26-50 performed the bulk of income-generating labor, including crop farming, tending to grazing animals, and jobs outside the home, as well as tasks culturally associated with “women’s work” (fetching water and childcare). Leisure was fairly equally distributed across age groups.
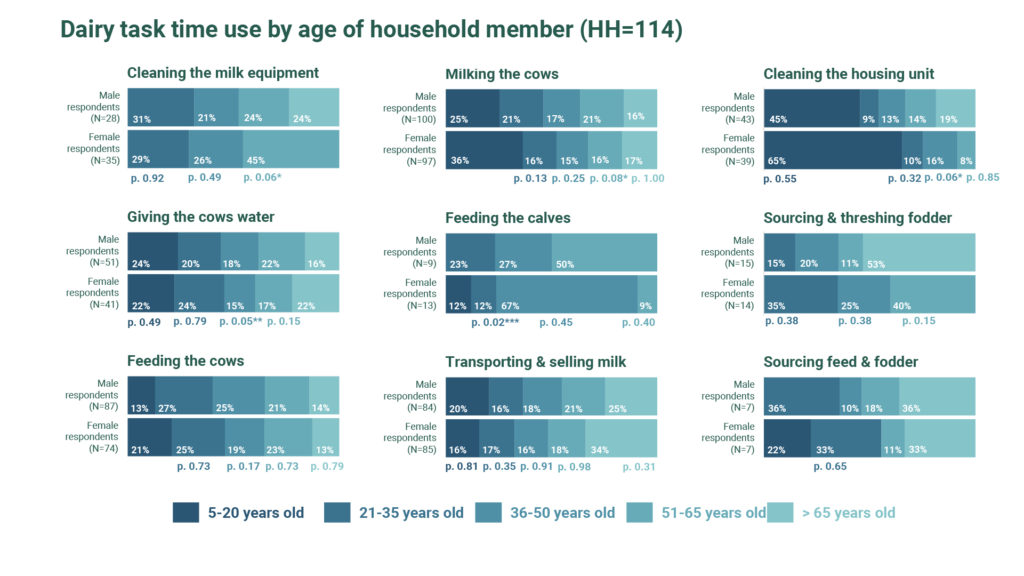
Of the 20 dairy tasks that each respondent was able to select from, nine were selected by respondents in our sample: cleaning the milking equipment, giving the cows water, feeding the cows, milking the cows, feeding the calves, transporting and selling milk, cleaning the housing unit, sourcing and threshing fodder, and sourcing feed and fodder. Figures 3 and 4 below applies the same analysis to these tasks as applied above to the responses on household time use: that is, Figure 3 analyzes the differences in male versus female respondents’ perceptions of household members’ dairy time-use by the gender of the household member, and Figure 4 analyzes this in terms of household member age group.
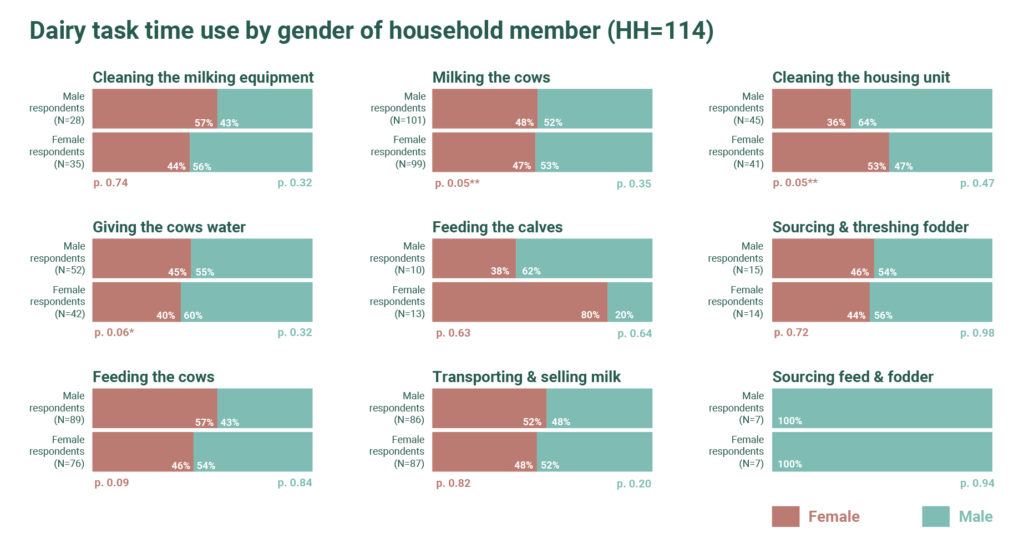
For most tasks, labor appears to be split fairly evenly by gender. A possible exception to this rule is feeding of calves, which female respondents assert is performed more by women than by men at a ratio of 4:1; men disagree on this, however, which is statistically significant at the 5% level, though the relatively low sample size makes it hard to put too much stock in this comparison. Further analysis could examine whether there is a difference based on a household’s production system. For example, in zero-grazing (or semi-zero-grazing) households, domestic tasks may account for a larger share of household labor, in turn skewing labor allocation toward the purview of women.
In addition to splitting labor by gender, dairy-related labor also appears to be distributed relatively evenly across age groups. The exceptions to this rule are “feeding the calves” and “cleaning the housing unit,” which according to female respondents – but not male respondents – is overwhelmingly performed by younger populations. Though difficult to say conclusively, a possible explanation for this difference in reporting is that female respondents may be more aware of how labor is divided on these tasks, which tend to be domestic in nature.
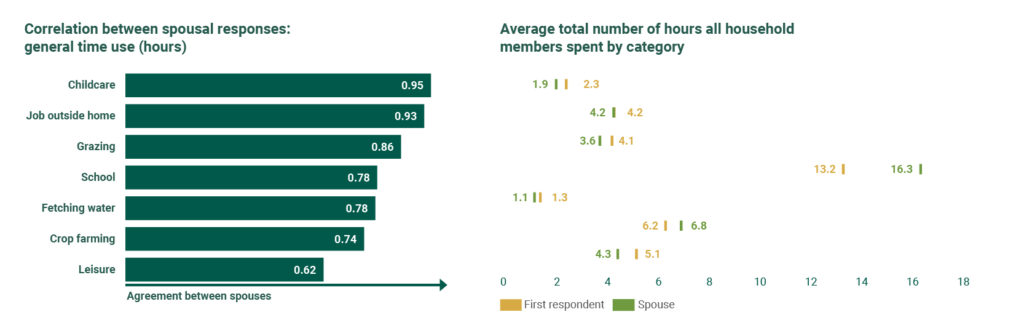
While on average there seems to be a great deal of agreement between spouses in our sample, this does not preclude the possibility of variation in the degree of agreement across households. Figure 5 below displays a measure of within household agreement by calculating the correlation coefficient in the vector of responses provided by women and men respondents in the same household. If, for example, on average, most husband and wife pairs agree on the time spent within the household on childcare, the correlation coefficient will be closer to 1. If they systematically disagree, the correlation coefficient will approach -1. If the correlation coefficient is close to zero, there is no clear agreement between husbands and wives within the same household on how tasks are distributed among household members. In our survey, there was a high degree of correlation between spousal responses for general time-use categories (i.e., crop farming, childcare, leisure, etc.).
Knowledge
Prior to measuring actual analytical skills and technical knowledge, we asked respondents to subjectively indicate which household members possessed knowledge in five categories: nutrition, artificial insemination, hygiene, disease, and feed. We then calculated the total percentage of individuals within a household perceived to have knowledge on a topic by gender (Figure 6) and age group (Figure 7).
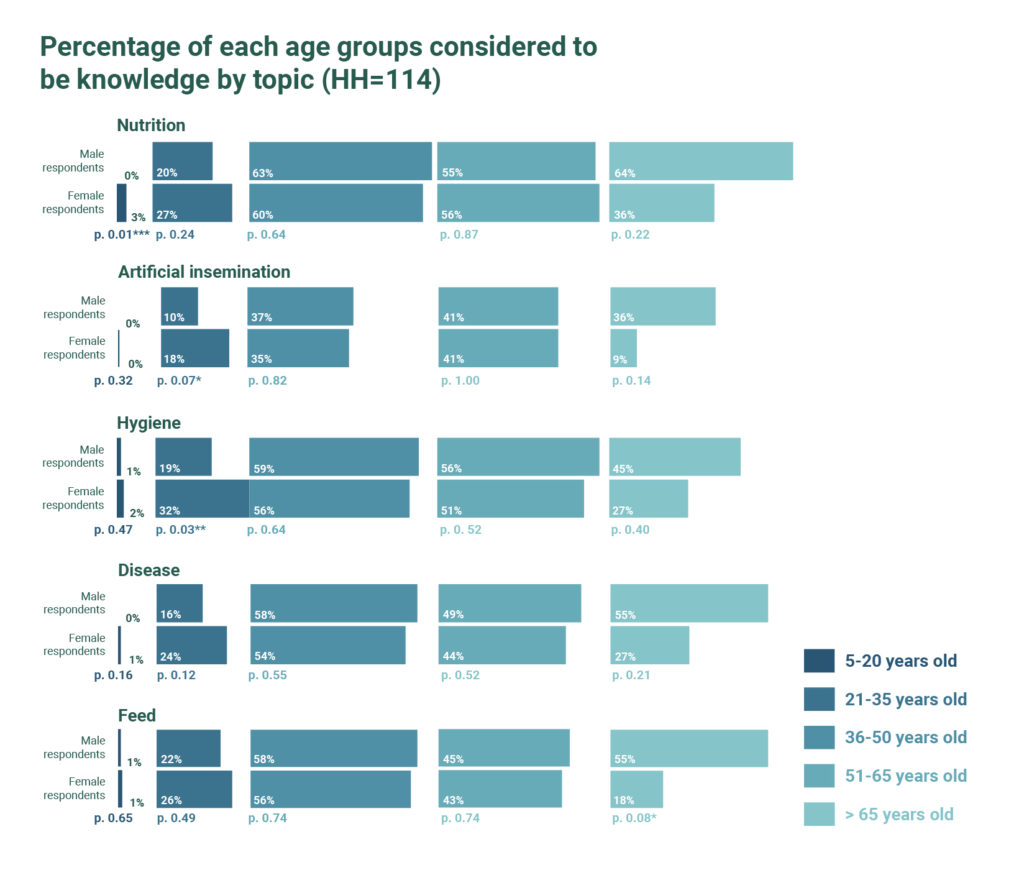
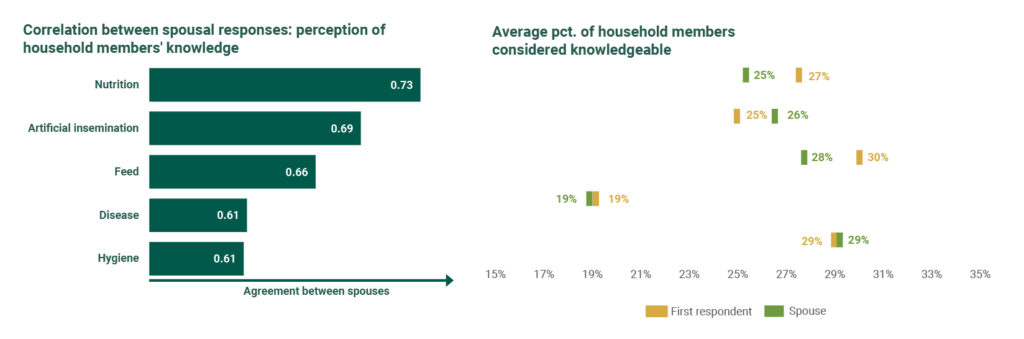
Across all categories, both male and female respondents perceived male household members to be more knowledgeable; there was broad intra-household agreement on knowledge perceptions as well (see Figure 8). Interestingly, male household members were judged to be especially knowledgeable in categories such as disease and artificial insemination; this was particularly true in the eyes of male respondents, who judged male household members to be at least twice as knowledgeable as women about these subjects. One hypothesis for this is that these subjects may carry a connotation of expertise due to their affiliation with actual professionals (i.e. veterinarians). By contrast, the perceived knowledge gap was a lot lower for other categories, such as nutrition and hygiene.
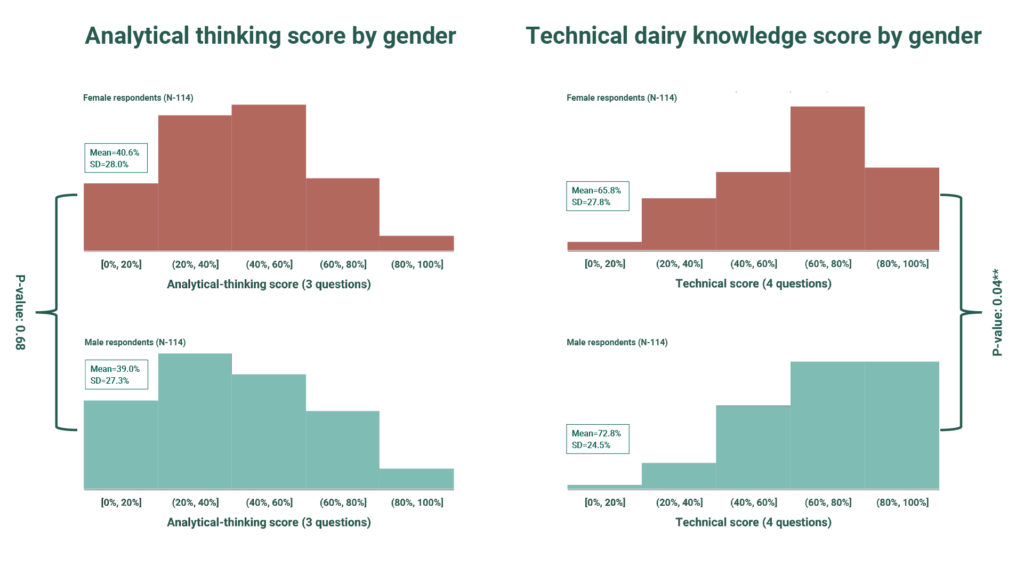
In fact, when tested, male respondents did perform significantly better than female respondents in terms of technical knowledge, with a mean score seven percentage points higher. That said, male respondents performed no better than female respondents on a test that used scenario-based questions to measure analytical thinking.
That said, two caveats must be considered in drawing conclusions from these results (shown in Figure 9): First, these results measure respondent knowledge rather than directly evaluating the knowledge of all household members. Second, the tests were brief and covered a broad array of subjects, making it impossible to evaluate whether the respondent may have deep knowledge on a particular topic. Both of these gaps suggest promising areas for future research in order to better understand the degree to which perceptions of knowledge match reality, rather than merely reflecting cultural biases; in reality, the answer may well be both, though additional empirical analysis is needed to make this claim.
Financial Agency, Intra-Household Decision-Making, and Trust
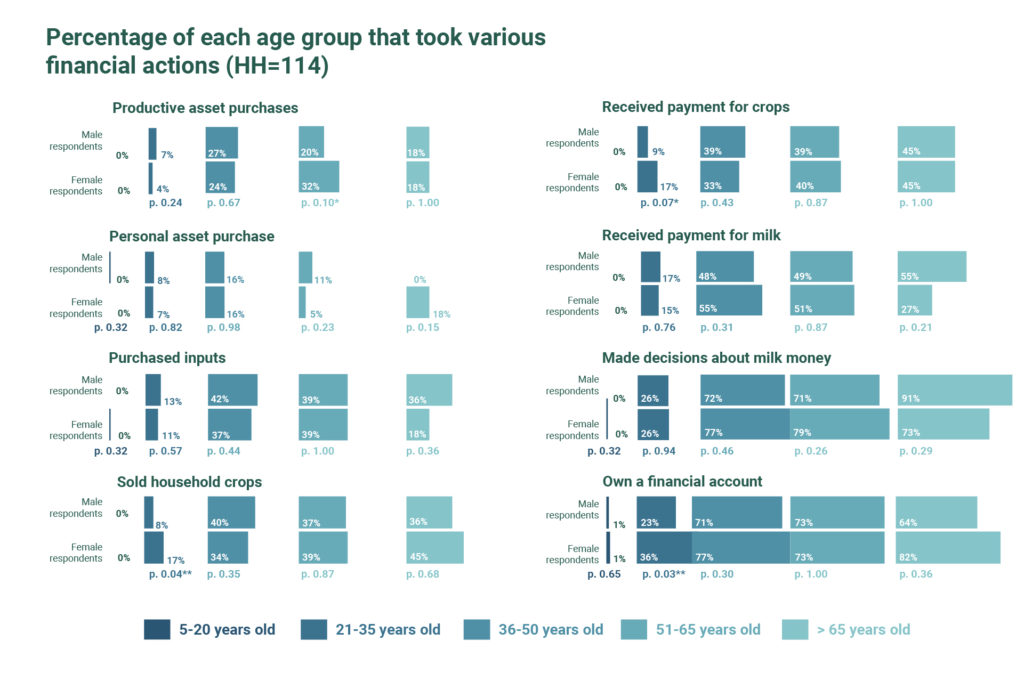
Respondents were asked a series of questions regarding their perceptions about who controlled money within the household: who in the household purchased productive assets, purchased personal assets, purchased inputs, sold household crops, received payments for crops, received payments for milk money, made decisions about spending milk money, and owned a financial account. Figures 10 and 11, respectively, analyze these results by gender and age of the household members.
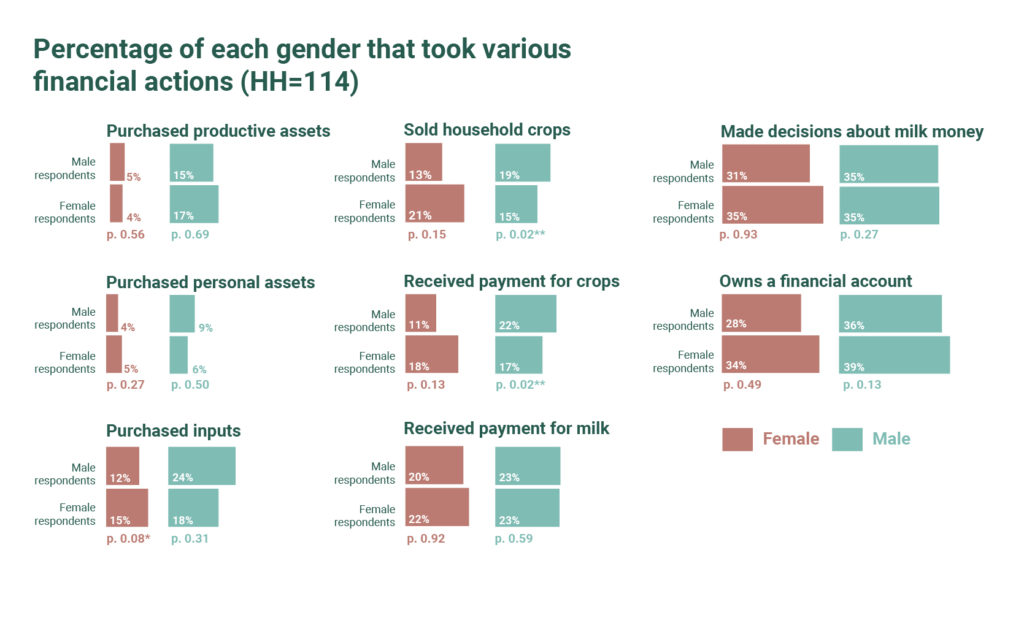
Very few household members were reported to have purchased personal assets; more – overwhelmingly men – purchased productive assets, according to both male and female respondents. Male and female respondents also agreed that payment for milk money and decisions about milk money were generally split evenly within the household. Both male and female respondents also reported that household members of both genders owned financial accounts (though men did so to a slightly higher degree).
There was less agreement by respondent gender about crop farming. Male respondents reported that male household members played a larger role in selling crops, whereas female respondents reported the opposite. This same pattern was true regarding respondent perceptions of who received payment for crops. In both cases, the difference in the perception of different genders was statistically significant at the 5% level. Additionally, while respondents of both genders agreed that more male household members purchase inputs than female household members, male respondents reported the ratio to be 2:1, while female respondents reported this difference to be marginal; this disagreement was weakly statistically significant (at the 10% level). Within households, there was also comparatively more disagreement on the measures related to crop farming and associated income, as shown in Figure 12.
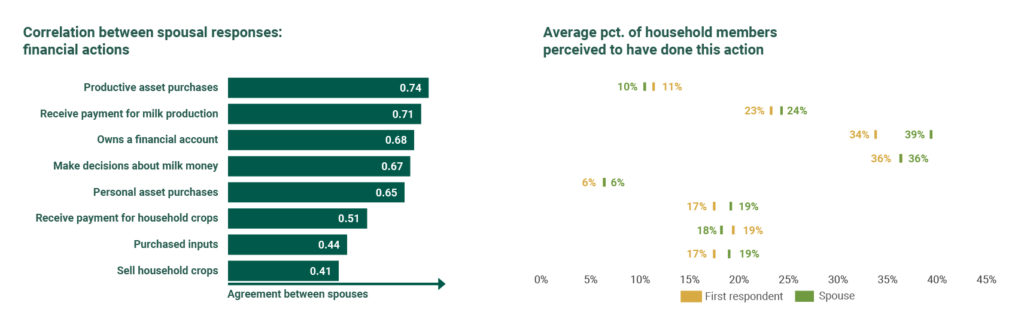
There are several potential explanations for the disagreement on this measure. One potential reason is there may be an internal lack of clarity within the household about who performed which category of tasks. This does not necessarily mean that individual tasks do not have a “clear” owner; alternatively, the divisions we at PxD made for the purposes of this survey may not correspond to household constructs around the division of finances. This suggests a possible area for future research: an open-ended survey consisting of structured interviews on this topic may yield interesting insights regarding financial accountability and power within the household.
Moreover, the disagreement may reflect the fact that some tasks may be performed jointly (or in an alternating fashion) with other household members; this possibility need not be mutually exclusive with alternative divisions of labor within the household. The results in Figure 13 suggest this possibility. When asked who makes financial decisions about the farm, the majority of women (62%) and men (82%) said they made this decision together with their spouse; an additional 25% of women said they did so jointly with the household head. Even who the “primary” decision-maker was could be muddled, with 72% of women and 50% of men claiming to occupy this role jointly with either a spouse or household head.
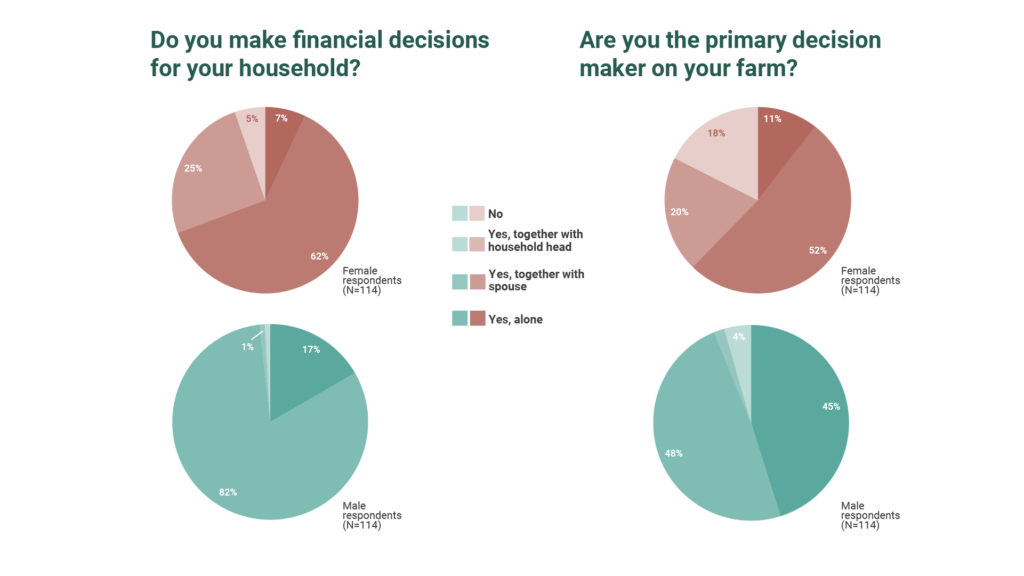
These results are ambiguous regarding whether each decision is made jointly or whether men and women have different spheres of influence within the household (and financial discretion within those spheres). However, the Likert scale questions, in which respondents were asked to agree or disagree with a number of statements about intra-household decision-making suggest that many decisions are made jointly – or at least with a substantial discussion between household members. (Figure 14)
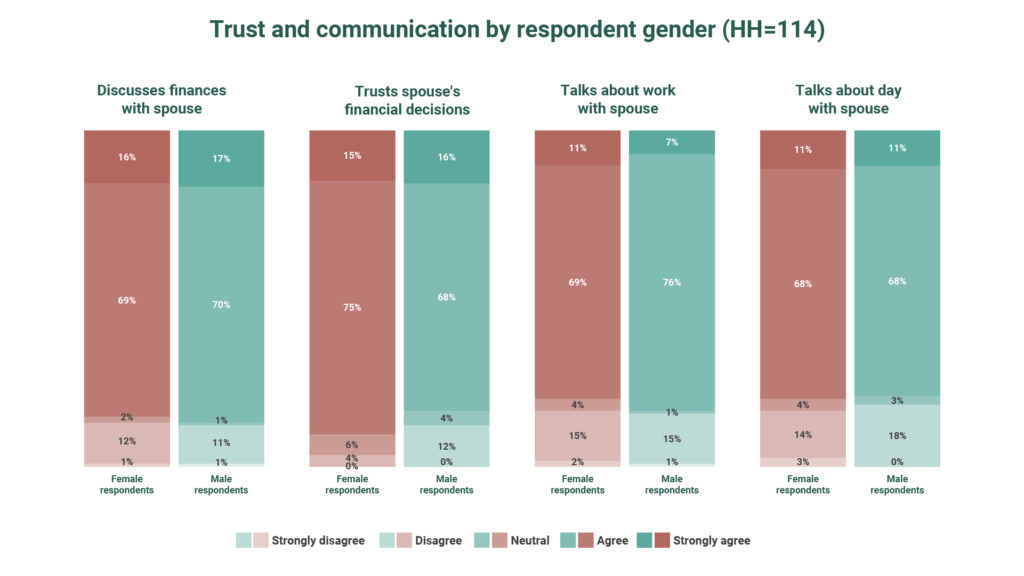
Eighty-five percent of female respondents and 87% of male respondents reported that they discussed finances with their spouse; moreover, 90% of female respondents and 84% of male respondents reported that they trusted their spouse’s financial decisions.
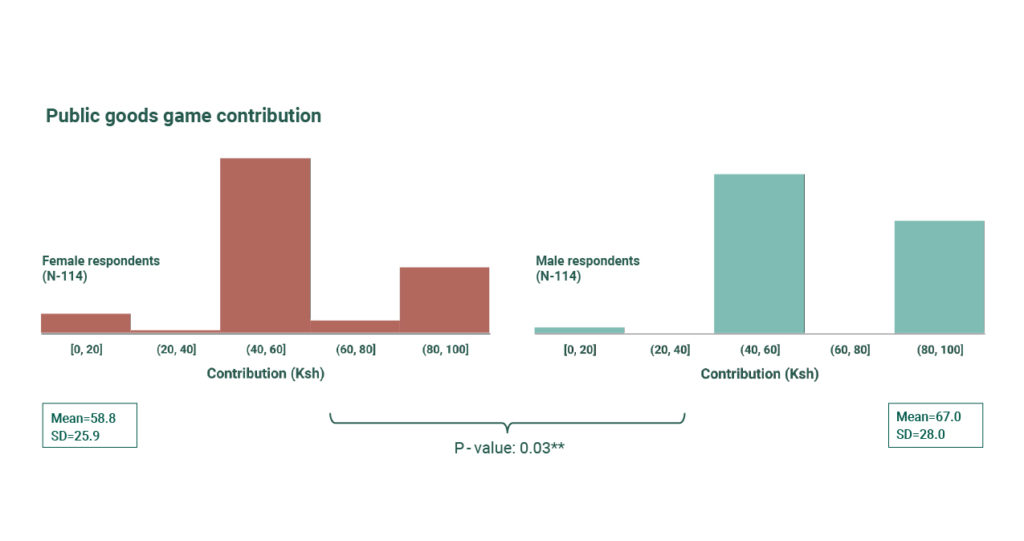
In order to empirically test these subjective responses, we also asked respondents to participate in a “public goods game,” in which they could choose to augment a portion of the financial incentive they earned for completing the survey (100 Ksh, or about 1USD) to a common account. Contributing a greater amount theoretically indicates a greater degree of cooperation with one’s spouse since the amount in the common account was split evenly between spouses after both completed the exercise, regardless of how much each spouse contributed individually. The results of this game suggest a moderate amount of trust, with contributions for both women and men clustering around the midpoint of the range between zero and the total possible contribution. Figure 15 displays the distribution of these respondents’ contributions. While male respondents contributed more on average (statistically significant at the 5% level), the plurality of respondents of both gender contributed a medium amount (i.e., 40-80 Ksh)
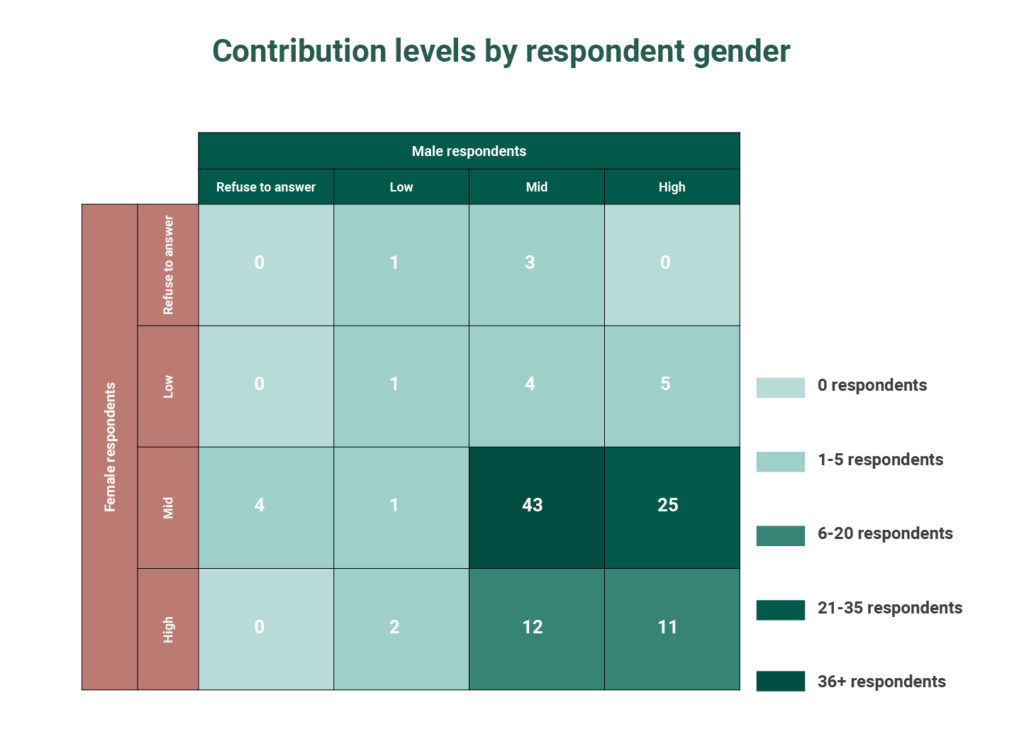
One way to empirically evaluate whether the public goods game in practice aligns with subjective cooperation in the household is to directly compare these results. First, we regressed the correlation coefficient between the spouse’s individual Likert responses – that is, the degree to which husband and wife agreed about their level of trust or communication – on the various contribution categories (limited the covariates to the bottom quadrant of Figure 16, to make sure each category reflects a sufficient sample of people to draw meaningful conclusions). The results of this regression are shown in Table 2. There was not a high correlation between these metrics, with none of the contribution categories predicting agreement between the spouses regarding the degree of cooperation.
The next stage of analysis was to compare directly the responses to the Likert scale questions on intra-household communication and trust to the public goods game contributions. To do so, we first split the sample by respondent gender and then ran ordered logit regressions separately for each sample (Table 3). In these regressions, a positive coefficient signifies that a member of a household in that specific contribution category is more likely to “strongly agree” with the statement. To make this concrete, the variable “female mid, male high” in the female sample is equal to one for a member of that population who contributed a medium amount (40-80 Ksh) and whose husband contributed a high amount (80-100 Ksh), and is equal to zero otherwise. A positive coefficient on this variable means that a respondent in this category is more likely to “strongly agree” with an affirmative statement on the Likert response; e.g. for the first regression in the table, she is more likely to say she often discusses finances with her spouse. While all the coefficients for the regressions on the male sample and about half of the coefficient for the regressions on the female sample are positive, none of the results in either sample are statistically significant.
Since the public goods game contributions do not align with subjective measures of intrahousehold cooperation, it is unclear whether respondents are less trusting in practice than they aspirationally report to be on the subjective questions, or whether the public goods game does not accurately measure intrahousehold trust. The answer may be a combination of the two or may vary by Likert category. This suggests an area for future research.
Next Steps
This information is valuable for informing the design and operation of a dairy service that empowers rather than further marginalizes female farmers. It bears mentioning that we will continue to monitor engagement by gender to validate the insights of this survey on an ongoing basis and to make sure that we continue to reach women farmers.
That said, there are a few points we can take away from this dataset –
and we can use it to identify areas for additional research:
- In general, women and men reported that they split labor related to crop farming and grazing, and both females and males reported going to school and pursuing leisure activities. Unsurprisingly, women reported spending more time fetching water and engaging in childcare relative to men, and men were more likely to have a job outside the home. Perhaps more surprisingly, most dairy tasks were split relatively evenly by gender. Further research could investigate the ways different production systems influence household division of labor: for example, since women generally take charge of more domestic tasks, in zero-grazing households is dairy-related labor more commonly performed by women?
- Both men and women perceived men to be more knowledgeable on all topics asked about (nutrition, hygiene, artificial insemination, and feed). One positive of digital advisory compared to traditional in-person systems is that both women and men are able to read the advice on their own, and thus may be less subjected to the influence (and doubts) of peers and other household members. However, this knowledge gap may have implications for marketing: if women are systematically viewed as less knowledgeable, men may find a service that aims to disrupt that balance in the household to be threatening. Additionally, the perceived knowledge gap may pose a barrier to adoption of recommendations by women if proposed without male buy-in and perceived to not know what they are talking about.
- The allocation of financial power in the household was far from clear-cut. A similar proportion of both genders received payment for and made decisions regarding milk money, and respondents of each gender disagreed as a group about which gender sold and received payment for crops. Additionally, the majority of respondents of both genders reported making financial decisions and being a “primary decision-maker” – either individually or jointly with a spouse or household head. Finally, both male and female respondents reported discussing finances with their spouse and trusting their spouse’s financial decisions. While this has positive implications for adoption of advice by both genders, it also suggests that many decisions are made jointly and buy-in from both spouses is necessary for implementation.
- The responses of respondents of both genders to the Likert scale questions suggest a high level of intra-household communication, trust, and cooperation, at least in the subjective opinions of respondents. Similarly, the vast majority of respondents of both genders contributed at least a medium amount (40 out of a possible 100 Ksh) to the common account in the public goods game. This has positive implications for adopting recommendations, which in many cases will require collective household buy-in. That said, there remains opportunity for a more granular understanding of intra-household cooperation. For example, how does it differ in households with more defined household and/or farming roles, or in households where one spouse is clearly knowledgeable? (While this dataset contains questions to this effect, the sample size is too small to draw meaningful conclusions about precise subsets of respondents.) Outside of this data, what impact do production systems (i.e. zero-grazing) and use of particular technologies (e.g. machinery such as chaff cutters or other equipment, such as durable water tanks) have on the level of intra-household cooperation?
While the effort to better understand our service users is ongoing and our efforts to improve content and delivery are constantly evolving, this data collection yielded meaningful insights and constituted a significant step towards inclusive product and service design that can be put to use in PxD’s Kenyan dairy service – and more broadly in programming across the region.
Since August 2020, PAD has collaborated with the International Fund for Agricultural Development (IFAD), a UN affiliated multilateral agency, to deliver digital advisory to assist smallholder farmers in Kenya, Nigeria and Pakistan to boost productivity and resiliency as they navigate the evolving impacts of the COVID-19 pandemic.
On 05 May 2021, IFAD convened an #IFADinnovationtalk webinar to showcase our partnership under the auspices of presentations and a panel discussion entitled ‘Digital Agriculture and the Rural Poor: Challenges and opportunities in delivering results’. Keynote speeches were delivered by Michael Kremer, PAD co-founder and Nobel Prize winner, and Owen Barder, PAD CEO. Our colleague Uzoamaka Ugochukwu, Nigeria Country Launch Manager, participated in a panel with Vivian Hoffman (a PAD research partner at IFPRI) and Dr. Zahoor-ul-Hassan (a key champion of our work in the Government of Punjab, Pakistan), and Patrick Habamenshi (country manager of IFAD Nigeria).
As Owen Barder, PAD’s CEO, stated in his keynote address, our collaboration with IFAD has demonstrated:
First, that our services can be replicated, adapted and scaled in new geographies, and can be scaled up to new target populations in existing geographies;
Second, that we have been able to develop and deploy surveys and A/B tests to quickly and accurately gather and analyze information from users to improve our services and adapt to evolving challenges in near real time; and
Third, the combined capabilities of governments, multilateral organizations and non-profit service delivery organizations can deploy services quickly and at scale, using local talent and shared knowledge and systems.
The full text of Michael Kremer’s contribution is accessible here; Owen Barder’s speech can be accessed here; and a full recording of their presentations, panel discussion and subsequent Q&A is accessible via the video posted at the top of this page.
We envisage this our partnership with IFAD as both a mechanism for recovery from the devastating effects that the COVID-19 pandemic has had on smallholder farmers, and an investment in better ways of delivering agricultural information in the long term.
We are excited at our progress in advancing our systems to complement IFAD’s work in support of poor rural farming families and look forward to further success as we continue to work together to service poor, rural families with valuable and productive information.
Owen Barder, CEO
Research Associate Sam Strimling argues that one must understand the specific needs of women to inform effective service delivery and presents an upcoming effort to gather these insights prior to launching a PAD advisory service aimed at Kenyan dairy farmers this summer. This post is the first of a two-part series, in which the subsequent installment will provide an analysis of the results for the survey described in this post. This is also the third in a series of blog posts on gender and digital development to mark International Women’s Day and Women’s History Month.
PAD empowers smallholder farmers across the developing world with actionable information to improve their wellbeing. However, there is evidence that digital advisory services like ours are underused by women. This summer we are expanding our agricultural advisory service in Kenya to the dairy sector, an arena in which women play a central role. As we prepare to launch, we are looking beyond one-size-fits-all solutions to more effectively address the unique needs, preferences, responsibilities, and constraints of female farmers.
This post is the first of two about a survey we are conducting in April 2021 to better understand gender roles and power dynamics in Kenyan dairy production and to better target our new service to the underserved needs of women in this sector. Here we describe the motivation and design of this survey. In a follow-up post, we will share insights from the results.
Invisible Women Farmers
In her spectacular book Invisible Women, Caroline Criado Perez details case after case in which service providers failed to deliver because they neglected to collect data about female users’ specific needs, preferences, and priorities.
The book cites the example of an organization seeking to provide “improved” seeds for staple crops: Male farmers cared more about increasing outputs. Women farmers, on the other hand, were more concerned with their input of time and labor in the field and in cooking the staple for household consumption. Since, adopting this new technology would require those doing the planting — women — to increase their time and effort, the seeds were not adopted.
Women often have less agency in agricultural and household financial decision-making. This is illustrated by Criado Perez who cites two failed attempts to introduce clean cookstoves capable of significantly reducing women’s exposure to toxic smoke. A model promoted in India required regular maintenance, which was considered men’s work. Since the new stoves improved women’s health, but didn’t directly affect men, stoves often fell into disrepair for want of maintenance. In Bangladesh, the fact that the clean cookstoves did not directly improve men’s outcomes, meant that they were not purchased at all, as men controlled household finances.
Understanding Context and Culture
Dairy is a sector of agricultural production in which tradition and gendered labor run deep. As we prepare to roll out our new advisory service, we commenced by focusing on a series of questions we need to answer to understand labor and decision-making dynamics in the sector, and within smallholder households more generally. These include:
- Who performs which tasks in the household, and within dairy farming specifically?
- Who holds the authority to make decisions?
- How systematically do users think about farming and what level of knowledge do they have about dairy farming? Does this differ by gender?
- Who controls household finances and for what types of purchases, and which accounts do they use?
- To what degree do women and men communicate about decisions and trust each other to make decisions in the interests of the household, even if one is the final arbiter of a particular decision?
The phone survey we designed to collect this information is due to be deployed in the field in early July, and will be asked to pairs of spouses. The goal is to obtain information to enable us to better target our services to both genders. By asking both men and women within the same household the same set of questions, we will be able to learn about typical responses for each gender, and we will also be able to note whether there are some questions for which we receive vastly different responses from a husband and wife within the same household.
Our survey will consist of six sections:
- Household Tasks and Time Use: This section will collect information about the gender(s) and age(s) of those performing various household tasks, including crop farming, livestock grazing, and water fetching. This section also attempts to account for household members’ time spent on other tasks, such as jobs outside the home and schoolwork. Information arising from this section will allow us to measure, for each time-use category, whether an activity is primarily performed by men, women, girls, or boys, or a combination thereof.
- Dairy Tasks: This section is similar to the Household Tasks and Time Use section, but focuses specifically on dairy farming, since the research team is most interested in using the results of this gender survey for informing the design and distribution of dairy advisory messages. This section will allow us to measure whether the following dairy tasks are primarily performed by men, women, girls, or boys: cleaning milking equipment, observing animals, giving cows water, feeding cows/calves, milking, milk transportation/sale, cleaning the housing unit (if zero-grazing or semi zero-grazing), sourcing/threshing fodder, spraying/dipping (for tick prevention), deworming, seeking veterinary treatment / artificial insemination (AI) services, identification (ear tagging), debudding/dehorning, hoof trimming, and grooming.
- Scenario-Based Questions: These are questions for which answers seek to understand respondents’ critical thinking abilities. An example of such a question would be: “Mrs Choge realized that to boost milk production beyond 7 litres a day, she needed to give her cow sufficient concentrates. For every 1.5 litres of milk above 7 litres, she gave 1 kg concentrate. How much concentrate should she give a cow producing 10 litres of milk per day?” We will disaggregate the results by gender to determine whether, on average, men or women think more systematically about dairy farming. This type of question tests the respondent’s causal reasoning, logical deduction, and systematic planning.
- Knowledge-Based Questions: This section is similar to the scenario-based section, but instead tests respondents on their technical dairy knowledge. As in that section, these questions have correct answers, and we will disaggregate the results by gender to determine whether, on average, men or women have more technical knowledge about dairy farming.
- Financial Decisions: This section will allow us to draw conclusions about who within the household holds financial power, with regards to purchases of productive assets, personal assets, and consumption goods. We will measure this empirically by collecting information, disaggregated by gender, on transaction amount as well as account type (digital/cash, joint/solo).
- Public Goods Game: In this section, respondents will be asked whether they want to augment the amount earned for participating in the survey by allocating a portion to a common account with their partner. A random amount will also be added to the survey by the research team, such that it is not possible for the respondent to lose money by completing this exercise, only to increase their earnings by a variable amount depending on the contribution made by both members of the spousal pair.1 This section allows us to collect data on trust within each spousal pair, which we assume to be correlated with the total amount contributed into the common account.
We plan to publish our findings to inform our own platform development and to make them available to other service providers and policy makers concerned with smart service design. In doing so, we plan to add to the existing body of research on gender and international development — a more complete review of which was published by my colleague Theresa Solenski in an earlier blog post.
Surveying the Evidence
Specifically, our research will add to the empirical evidence base on asymmetric information within the household. One study in Ghana found that on average, both men and women commonly underestimate or overestimate their spouse’s expenditures by more than 75%. Concerningly, this research found implications for profitability: the more imperfect the husband’s information about his wife’s expenditure, the lower the wife’s output/profit, and vice versa (Chen & Collins, 2014).
Another study from Uttar Pradesh provided an example in which women were less likely to adopt productivity-enhancing technology (in this case, laser land-leveling because they were less aware of its impact (Magnan et al. 2015)). Similarly, a study from Uganda in which agricultural videos were shown either jointly to a spousal pair, or separately to one member, found that information was not shared within the household when just one member was engaged (Lecoutere et al. 2019). These examples are particularly relevant to our work at PAD, as they highlight a way in which our service has the potential to fail: if our messages primarily reach men but women are charged with implementing the recommendations we provide (or vice versa), the suggested practices may not be adopted because we failed to get the information into the hands of women who can make it actionable.
Our survey will contribute to the literature on within-household asymmetric information in two ways. First, the sections on household tasks / time-use, dairy tasks, and finances will — in addition to providing information about gender roles — enable us to compare directly the wife’s knowledge of household affairs to that of her husband (and vice versa). Second, the sections quizzing respondents on dairy knowledge and testing of systematic thinking through scenario-based questions will measure within-household information asymmetries with respect to dairy farming.
Imperfect communication and limited trust also have implications for message adoption: Qualitative evidence from a focus group discussion with 113 male farmers and 141 female farmers in Malawi suggests that men often do not trust agricultural information received from their wives, and female farmers may be hesitant to suggest new agricultural practices for fear of retribution (Ragasa et. al., 2019). Another group of researchers partnered with Kakira Sugar Ltd., a large sugar company in Uganda that sources sugarcane through contracts with smallholder farmers, the vast majority of whom are men. This study implemented an intervention in which men were encouraged to transfer uncontracted blocks of sugarcane to their wives. Since both spouses needed to agree to the proposed intervention, whether the men were willing to do so provided in and of itself a measurement of trust. The researchers found a man was less willing to transfer the contract — i.e. was less trusting of his wife’s capabilities in this respect — if the household had fewer assets and/or expenditures, if his wife was not already involved in sugarcane farming, or if he had previously expressed a preference for managing the household’s finances himself (Ambler et al., 2021).
In our survey, we plan to collect novel data on trust within the household using the public goods game. Ambler et. al. applied a similar approach in their baseline survey, and collected time use data. They found that cooperation in the public goods game significantly predicted a husband’s willingness to transfer the contract to his wife, but time-use data collected did not have the same predictive power.
Finally, by collecting information on respondent demographics and knowledge alongside information about financial decision-making and intra-household communication and trust, our survey will add to existing literature about factors that influence bargaining power within the household. For example, a descriptive analysis of a Tanzania spousal dataset shows that a woman’s age, health, labor hours, and education were positively correlated with her authority to make decisions in the household; however, the number of children she had and her husband’s community standing were negatively correlated with this authority (Anderson et. al., 2017). In our survey, we plan to collect information on each respondent’s age, education level, and number of children, which we can use to disaggregate responses about financial decision-making and the amount contributed to the collective account in the public goods game. This will allow us to investigate whether factors similar to those observed in Tanzania hold weight in the Kenyan context.
Next Steps
We plan to begin the survey in early April and will interview approximately 600 dairy farmers via phone, over two rounds.2 We will first survey 300 respondents from dairy cooperatives, during which we will ask about contact information for their spouses. We will then complete a second round with the spouses of the first round participants.
The sample for the gender survey was constructed to select a representative sample for the two cooperatives interested in partnering with us for this survey, Sirikwa Dairies and General Limited and Katheri Dairy Farmers Cooperative Society. We chose these two cooperatives because they represent the two primary dairy producing regions in Kenya, and because they were able and willing to provide demographic information for their membership sufficient for us to stratify the sample by gender, total production, and total deductions on member accounts for expenses such as agrovet purchases, artificial insemination, veterinary services, and cash advances. This information will enable us to research intra-household gender dynamics for farmers of different levels of farming sophistication.
We expect this research will yield important insights, and we plan to publish the results in a subsequent blog post. The most important outcome, however, will be to improve our content and message delivery for the dairy farmers we serve.
_______________________________________
1. This approach has the added benefit of preventing the respondent from obtaining exact information about his/her partner’s contribution. We recognize that particularly female respondents may fear retribution if her partner were to discover her contribution and deem it insufficient. Our contribution is intended to prevent this outcome.
2. This number was arrived at using Cochrane’s (1977) formula with a margin of error 7.5% and confidence interval of 95% (both commonly accepted levels) to come to the following sample size of households for each dairy: 148 in Sirikwa and 145 from Katheri. Multiplying both numbers by two, we arrive at a minimum sample size of 586, which we round up to 600 for simplicity..
Sam Strimling, a Research Associate on PAD’s Kenya team, reflects on the results of a third round of interviews surveying farmers and agro-dealers across Kenya’s agricultural heartland.
CONTEXT
In December 2020, Precision Agriculture for Development (PAD) interviewed 509 crop farmers and 274 agro-dealers registered on the MoA-INFO SMS platform in Kenya. This survey was the third and final round of a panel survey, of which the first round took place between late April and early June 2020, and the second took place from August to early September 2020.The first two rounds of surveys focused on the long rainy season, which is the main agricultural season in Kenya, and the third round examined the short rainy season. Data from all three survey rounds are visualized on our COVID-19 Dashboards.
During the survey period, COVID-19 continued to spread globally and in Kenya. Since the first reported case in Kenya on March 13, according to statistics collated by the World Health Organization, as of February 2, 2021, there have been 100,773 confirmed cases in Kenya, and 1,763 COVID-related deaths.
By the time of the survey, restrictions to mobility and social interaction that had been imposed in March and April in an effort to slow the spread of the virus had been relaxed: A nightly 7pm-5am curfew, first imposed on March 27, was revised to 9pm-4am on June 7. On April 6, a lockdown was imposed on Nairobi, which eventually covered five counties (Nairobi, Mombasa, Kilifi, Kwale, and Mandera). As of July 7, restrictions on movement other than curfew were lifted. Domestic flights also resumed on July 15, and international flights resumed August 1.
SAMPLE CHARACTERISTICS
In order to track the evolving economic and social effects of COVID-19 with the same population over time, across all rounds, we interviewed 1,471 farmers and 735 agro-dealers.
While individual respondents differed slightly across the three survey rounds, the demographics of the survey group remained similar. The below charts summarize select demographic information for both the farmer and agro-dealer surveys:
| Round | Total respondents | Counties represented | % male | Avg. age | % who grew maize as their primary crop |
| Round 1 | 973 | 44 | 58% | 41 | 79% |
| Round 2 | 974 | 44 | 57% | 42 | 80% |
| Round 3 | 509 | 42 | 56% | 44 | 53% |
The major difference in the farmer demographics across rounds is the percentage of farmers growing maize as a primary crop. It appears a large share of farmers grew beans rather than maize in R3, with 17% of R3 respondents reporting beans as their primary crop — up from 4% in R2. This makes sense in light of the larger seasonal context: farmers tend to focus on maize production during the long rainy season but diversify their crops during the short rainy season.
| Round | Total respondents | Counties represented | % male | Avg. age | Avg. annual sales (2019) | Avg. number of employees |
| Round 1 | 483 | 40 | 68% | 46 | US$11,351 | 2.2 |
| Round 2 | 427 | 40 | 72% | 45 | US$11,348 | 1.8 |
| Round 3 | 274 | 35 | 71% | 46 | US$10,564 | 1.5 |
In an effort to build a panel dataset to track change over time, we prioritized contacting farmers who had participated in our earlier surveys. Respondents who participated in R1 and/or R2 were prioritized; all R1 and R2 respondents were called three times before new respondents were called. Of the farmers interviewed in Round Three (R3), 70% participated in Round Two (R2) and 53% participated in Round One (R1). Of the agro-dealers interviewed in R3, 57% participated in R2 and 55% participated in R1.
FINDINGS
Farmers’ expectations for the previous (2020 long rainy) season were not been met, and farmers anticipated difficulties in purchasing sufficient inputs for the upcoming (2020 short rainy) season
Fifty-eight percent of R3 farmers reported a lower yield relative to the 2019 long rainy season, belying expectations expressed in R2 and R1 when 49% and 52% of farmers, respectively, said they expected a larger harvest relative to the previous year due to good rains and, reportedly, improved farming practices. The reasons cited by farmers in R3 for lower observed harvest were varied: 29% of farmers with a lower observed harvest in the 2020 long rainy season attributed this to excessive rains, with another 24% citing insufficient rain. Additionally, 24% explained that they had used fewer inputs. This makes sense given that 76% of R2 farmers anticipated difficulties purchasing sufficient inputs for the impending short rainy agricultural season, with 66% reporting they did not have enough money to do so.
Furthermore, of the 42% of R3 farmers who had sold all or some of their harvest from the long rainy season, 58% reported receiving a lower price versus the previous year. This again conflicted with the expectations of R2 and R1 farmers, of whom 58% and 66%, respectively, reportedly expected a higher price compared to the 2019 long rainy seasons. The primary perceived cause for dashed expectations appeared to be supply outstripping demand, with R3 farmers who received a lower price for harvest sold citing both higher market supply (43%) and fewer buyers (34%).
Still, expectations for the upcoming short rainy season were much more mixed, with 42% of farmers anticipating a lower harvest and 39% anticipating a higher harvest. These expectations in turn depended on those about rainfall: both the plurality of farmers who expected low harvests, as well as those expecting large harvests, cited rainfall as justification for these expectations. Price expectations in turn depended on expectations about supply: of the 54% of farmers who reported expecting a higher price for their forthcoming harvest, 60% attributed this to low production/market supply. Similarly, of the 31% of farmers reportedly expecting a lower selling price, 60% attributed this expectation to high production/market supply.
However, 80% of R3 farmers anticipated difficulties purchasing inputs for the 2021 long rainy season, a concern 62% attributed to lack of resources. In this way, R3 expectations were a continuation of earlier trends. Agro-dealers confirmed that prices were higher, with 62% of those interviewed in R3 reporting they had increased the prices charged to farmers relative to the same season previous year. This, too, was in line with earlier rounds: 65% of agro-dealers surveyed in R1 and 55% of those surveyed in R2 reported year-on-year price increases for the same set of inputs. However, with agro-dealers facing financial troubles themselves, the only way to stay in business may be through the practice of passing on high prices from suppliers, which have also increased according to 71% of agro-dealers interviewed in R3. Across all rounds, agro-dealers were statistically more likely (at the 1% level) to report charging farmers higher prices if the prices charged to them by suppliers had increased. Farmers’ inability to secure the necessary inputs may in part account for low harvest (and, consequently, high sale price) expectations for the season.
That said, agro-dealers are optimistic about their ability to satisfy the needs of the farmers who did attempt to buy from them: only 8% of R3 agro-dealers anticipated that they would be unable to meet farmer demand, compared with 26% in R2 and 29% in R1. The largest concern — cited by 71% of those in R3 who predicted they would be unable to meet farmer demand — was having insufficient resources to do so.
Continued food shortages and financial distress, relative to 2019
On a positive note, farmers experienced improved household consumption patterns compared to previous rounds, as they adapted to changing circumstances and as restrictions on mobility were lifted. Additionally, some of the improvement in consumption may be due to seasonal changes, as 42% of R3 farmers reported selling at least some of their seasonal harvest from the long rainy season, which means they likely have more cash on hand for household purchases. In R3, 62% of farmers reported difficulties buying food due to market changes over the past week – down from 71% of farmers in R2 and 87% in R1. Additionally, only 28% of farmers reported difficulty accessing markets over the past week due to mobility restrictions. This is just under half of the number who reported this issue in R2 (44%), which was in turn down versus 48% in R1. In further good news, over the past week, significantly fewer farmers in R3 reported reducing the number or size of household meals, reducing the amount of food purchased due to reduced income, and changing their diet composition. (Refer to the table below for the relevant statistics.)
That said, farmers still experienced significant distress compared to before the pandemic. In December 2019, just 8% R3 respondents reported difficulties buying food due to market changes, 5% reported mobility restrictions, 18% reported difficulties purchasing food due to reduced income, 16% reported reducing the size and/or number of meals, and 16% reported changing their diet composition.
| Experience | Dec. 2019 | May 2020 (R1) | Aug. 2020 (R2) | Dec. 2020(R3) |
| Difficulty purchasing food due to market changes | 8% of respondents | 57% of respondents | 47% of respondents | 21% of respondents |
| Difficulty going to the market due to mobility restrictions | 5% | 48% | 44% | 28% |
| Difficulty purchasing food due to reduced income | 18% | 63% | 70% | 51% |
| Reduced number and/or size of meals | 16% | 46% | 62% | 49% |
| Changed composition of meals | 17% | NA | 65% | 53% |
Business as (new) usual?
In an effort to adapt to changing circumstances, agro-dealers across all three rounds made changes to stocking, sales, and operations. Compared with R1 agro-dealers, R2 agro-dealers were statistically more likely to make changes across all three categories, and R3 agro-dealers were statistically more likely to make changes to sales and operations versus R2 agro-dealers. They were also slightly more likely to report making changes in stock, although this result was not statistically significant. (Refer to the below table for the relevant statistics.) These trends suggest changes to the business were imperative for long-term survival.
However, while agro-dealers may have reached a new normal in their stocking practices, sales, and operations, business has not returned to pre-pandemic levels. Instead, agro-dealers face serious economic headwinds and a difficult business environment. R3 agro-dealers were statistically more likely than R2 agro-dealers to report lower expected footfall, lower observed sales, and lower expected sales. Fifty-four percent of R3 agro-dealers who observed low footfall attributed this to insufficient resources and the same proportion gave the same reason for low sales. At this stage, respondents perceived the prolonged economic slowdown to present a larger obstacle than government-imposed restrictions or public health precautions.
| Experience | Round 1 | Round 2 | Round 3 |
| Stock changes | 31% of agro-dealers | 53% of agro-dealers | 56% of agro-dealers |
| Sales changes | 29% | 54% | 77% |
| Operations changes | 63% | 71% | 86% |
Specifically, in Round 3, 25% of all respondents reported reducing stock and 22% reported and implementing cashless/electronic transactions with their suppliers as a means of coping with the pandemic. Thirty-five percent of agro-dealers also reported implementing cashless/electronic transactions with farmer-customers. The largest changes to sales, however, were increased hygiene measures (handwashing stations, wearing gloves, etc.), undertaken by 51% of agro-dealers, and social distancing, performed by 39% of agro-dealers. Similarly, 62% of agro-dealers reported encouraging handwashing and 51% reported enforcing social distancing as key changes to operations. With the increasing implementation of these measures — and the relaxation of the nationwide curfew and mobility restrictions — agro-dealers were able to resume their pre-pandemic shop hours in R2 and continue through R3.
Additionally, as farmers adapted to the changing conditions, initially differential reactions by gender appear to have converged. In R1, female crop farmers were statistically more likely than their male counterparts to report that household members were spending fewer days on their own farms and paying higher prices for fertilizer (relative to the previous year); this was not the case in R2. However, in both R1 and R2, female crop farmers were significantly more likely than their male counterparts to report that they had had to rely on assistance from family to cover living expenses and were more likely to report having to reduce the size or number of meals served in the 30 days prior to being surveyed. Yet, by R3, there were no statistically significant differences by gender in measurements of production or consumption.
RECOMMENDATIONS
In R3, we asked farmers and agro-dealers directly which interventions or services could help them adjust to ongoing changes in the business environment associated with the pandemic. The purpose of this question was to inform program design not only for PAD, but also for other NGOs, government actors, and other stakeholders in the development community at large.
Our recommendations, informed by respondents’ preferences, fall into three buckets:
- Direct and indirect financial assistance: Unsurprisingly, given the reportedly difficult business environment, 18% of agro-dealers requested direct financial assistance and an additional 16% requested help acquiring inputs affordably. Similarly, 19% of farmers asked for provision of inputs, or requested particular inputs.
- Targeted advisory messages: Both agro-dealers and suppliers expressed a need for additional information. Twenty percent of farmers and 9% percent of agro-dealers requested general farming information, with an additional 7% of agro-dealers requested public health information. More specifically, when farmers were asked to rank proposed interventions pre-selected by PAD for their feasibility and mission alignment, many seemed eager to make the most of their limited funds: 31% chose as their first choice “information on soil testing,” while 27% ranked recommendations on less capital-intensive practices as a first priority.
- Improved market linkages: The plurality of agro-dealers (34%) ranked first “more information from farmers about input preferences,” suggesting a desire to improve market linkages. Along the same lines, the vast majority (96%) indicated they would be willing to share their contact information with interested farmers. Additionally, 91% of agro-dealers expressed a willingness to switch suppliers if a better price was offered. Given the trickle-down effect of supplier prices on the entire supply chain, providing agro-dealers with information and/or communication channels needed to improve their sourcing would help them stay in business while enabling them to meet farmers’ needs.
This research was funded by the COVID-19 Adaptation Fund, a joint initiative between the Global Development Incubator (GDI) and Instiglio. The aim of the Adaptation Fund is to collect data and find innovative solutions for service providers like PAD that serve vulnerable populations disproportionately impacted — socially and economically — by COVID-19.
Incorporating new survey data, and new visualizations, Dashboard 2.0 allows one to observe and compare trends across rounds of surveys and geographies.
Andrew Wang, a PAD summer research associate on the global research team, who was the primary creator of the new dashboard, writes:
The next iteration of our COVID-19 dashboard is here!
Dashboard 2.0 includes new survey data collected between mid-June and September 2020 in Kenya and two states in India. The new data complements, and is comparable with, Round 1 data collected in Kenya and one state in India in April and June. The updated dashboard also includes a new set of visualizations to illustrate temporal trends over the course of the pandemic.
Building on the first round of surveys in Kenya and State 1 in India, our team conducted a second round of surveys (R2) in Kenya between July and August, and in India between June and September. The updated dashboard also includes data from a round of surveys conducted in a second state in India (State 2) between May and July. Across all three regions, a total of 4,166 farmers, of whom 1,070 (25.7%) were women farmers, were surveyed and their responses are included in this updated dashboard. A third round of data collection is planned in Kenya and State 1 in India, and the dashboard will be updated in due course.
While specific trends differ between, and within, countries, there are several notable findings from the new visualizations. It should be noted that these trends are observational and that, on the basis of these survey results alone, cannot be causally attributed to COVID-19.
- Disruptions to labor markets in India appear to have lessened over the course of the pandemic as the Kharif (summer) cropping season got underway and lockdown restrictions eased. In August and September, over 70% of surveyed farmers in State 1 reported hiring at least as much labor as last year, compared to only 50% in May and June.
- However, measures of reported food insecurity rose throughout the summer in India, with over 60% of respondents reporting that they were unable to buy the amount of food their household usually consumed due to increased prices and/or reduced income. Towards the latter half of the summer, a greater fraction of farmers in both Indian states reported reducing their meal frequency or portions.
- In Kenya, the share of farmers reporting challenges with regard to buying food at affordable prices, or accessing markets decreased slightly (but consistently), from 99% in April to 84% in August. This suggests that market conditions may be recovering following the easing of COVID-related travel and curfew restrictions. However, increased household stress associated with diminished incomes is evident in an increase in the proportion of farmers who reported reducing meal frequency and/or the size of their portions.
- Across all three regions, women respondents were more likely than men to report that they had reduced the portion size or frequency of their meals.
- Notwithstanding these food concerns, when asked about COVID-19 related concerns the fraction of farmers who cited “not having enough food for the household” decreased over time in both Kenya and India State 1 surveys.
- During the second round of surveys in Kenya and State 1 in India, fewer farmers reported worrying about family members contracting COVID-19 (a steady decrease is observable from 57% in May to 34% in September). Concerns about personally contracting the disease also dropped in Kenya (53% in September compared to 67% in May), but not in the Indian state (52% in both May and September). This pattern is consistent for men and women farmers.
Further iterations of this work are in the pipeline: A third round of surveys will go into the field in Kenya soon, and we are developing a separate dashboard to visualize the impacts of the pandemic on Kenyan agro-dealers. Stay tuned!
For a deeper dive into the impacts of COVID-19 on smallholder farmers across geographies, gender, and time, take a look at the dashboard and read through our relevant policy notes and blog posts.
The Evolving Economic Effects of COVID-19 Among Smallholder Farmers and Agro-dealers in Rural Kenya
Sam Strimling, a Research Associate on PAD’s Kenya team, reflects on the results of a second round of interviews surveying farmers and agro-dealers across Kenya’s agricultural heartland.
AGRO-DEALER & FARMER COVID-19 SURVEY, AUGUST-SEPTEMBER 2020
Between August and September 2020, Precision Agriculture for Development (PAD) interviewed 974 crop farmers and 427 agro-dealers registered on the MoA-INFO SMS platform in Kenya. This survey was a follow-up to first round surveys undertaken between late April and early June 2020. Fifty-eight percent of Round Two (R2) farmer survey respondents and 60% of R2 agro-dealer survey respondents took part in Round One (R1).[1]
An overview of the results of this survey are summarized in this blog post. Please visit our organizational COVID-19 webpage to access survey instruments and background information, and to view a dashboard presenting global, and other country specific, insights from our survey data. A Policy Note has been produced as a complement to this post, containing graphic representations and additional information useful to policymakers.
CONTEXT
During the survey period, COVID-19 continued to spread globally. Since the first reported case in Kenya on March 13, there have been 38,923 confirmed cases, and 725 deaths.[2] At the same time, restrictions to mobility and interaction have been relaxed. A nightly 7pm-5am curfew, first imposed on March 27 was revised to 9pm-4am on June 7.[3] On April 6, a lockdown was imposed on Nairobi, which eventually covered five counties (Nairobi, Mombasa, Kilifi, Kwale, and Mandera). As of July 7, all restrictions on movement were lifted. Domestic flights also resumed on July 15, and international flights resumed August 1.
The results of PAD’s survey are intended to assist policymakers and the development community at-large to track the evolving economic and social effects of COVID-19. By conducting surveys with the same population over time, we are able to monitor shifts in reported welfare and expectations among smallholder farmers and agro-dealers in rural Kenya.
SAMPLE CHARACTERISTICS
Between April 29 and June 2, PAD interviewed 973 crop farmers and 483 agro-dealers.[4] Interviews of farmers and agro-dealers covered 44 and 40 counties, respectively. The farmers interviewed were 58% male, 41 years old on average, and 80% grew maize as the primary crop. The agro-dealers interviewed were 68% male and 46-years-old on average, owned Small to Mid-size Enterprises (SMEs), employing an average of two employees and averaging 1.3 million Kenyan Shillings (KSH – approximately US$12,000) in annual sales.
Between July 28 and September 3, PAD conducted a second round of surveys and interviewed a total of 974 farmers across 44 counties, including 561 who also participated in R1 and 413 who only completed the R2 survey. The total sample was 57% male and 42-years-old on average.
During the second round of data collection, PAD interviewed a total of 427 agro-dealers across 40 counties,[5] including 248 who participated in R1 and 179 who only completed the R2 survey. The total sample was 72% male, 45-years-old on average, and had an average of 1.5 employees and 1.3 million Kenya Shillings (KSH, or approximately US$12,000) in annual sales.[6]
FINDINGS
Farmers optimistic about current harvest, but anticipate financial difficulties will constrain their ability to purchase inputs for the short rains season
Farmers in both R1 and R2 communicated optimism about the prospects of a good harvest for the long rainy season which occurs from early spring to early summer.[7] During R1, 52% of farmers surveyed reported that they expected a larger harvest and 66% expected a higher sale price relative to the previous year. However, R1 came earlier in the long rainy season, when 89% of farmers had not yet harvested; by contrast, 25% of R2 farmers had harvested their crops at the time of their enumeration and an additional 20% had sold their harvest, or were engaged in post-harvest processing. Nevertheless, R2 farmers remained optimistic about volume and prices for the season’s harvest, with 49% of farmers reporting they expected a higher harvest and 58% reporting that they expected a higher sales price relative to this time last year. Expectations were buoyed by good rains and, reportedly, improved farming practices.
That said, 76% of farmers surveyed in R2 anticipated difficulties purchasing sufficient inputs for the impending short rains agricultural season, with 66% reporting they did not have enough money to do so. Agro-dealers similarly reported that a lack of financial resources negatively impacted their ability to meet farmers demand: of the 22% of R2 agro-dealers who said they did not expect to be able to meet farmer demand, 58% percent attributed this to insufficient capital. The next most commonly reported reason was constraints on the availability of inputs (51%). For comparison, of the 29% of R1 agro-dealers who reported that they would be unable to meet farmer demand, 71% attributed this to unavailable inputs, and just 11% reported having insufficient capital.
In both survey rounds, farmers and agro-dealers reported high input prices, which may be either a cause or an effect of decreased input availability. In total, 57% of farmers in R1 and 56% in R2 reporting that at least one key input (i.e. fertilizer, seeds, or pesticides) had risen in price relative to the same season last year. Similarly, 65% of agro-dealers surveyed in R1 and 55% of those surveyed in R2 reported year-on-year price increases for the same set of inputs. In turn, agro-dealers were statistically more likely to report charging farmers higher prices if the prices charged to them by suppliers had increased. Moreover, agro-dealers in R2, were statistically more likely to report price increases from suppliers than those surveyed in R1.
Continued food shortages and financial distress, relative to the same period in 2019
Farmers’ financial woes are also reflected in patterns of reported household consumption. In R2, 71% of farmers interviewed reported difficulties buying food due to market changes – a marked improvement from 87% in R1 – and fewer farmers reported difficulty accessing markets due to mobility restrictions (44% in R2 versus 48% in R1). On the other hand, elevated financial distress is suggested by shifting reported food consumption: 62% of R2 farmers reported reducing the number or size of household meals and 70% reported difficulties purchasing food due to reduced income, compared to 46% and 63%, respectively, in R1.
In R2, we asked farmers similar questions about their life experiences during the same period in 2019 in order to tease out the extent to which the reported difficulties were attributable to the pandemic as opposed to annual consumption patterns due to the agricultural cycle (i.e. “lean season”). The reported results strongly suggest that COVID-19 exacerbated normal seasonal difficulties. Just 20% of farmers reported difficulties buying food due to market changes in 2019 and only 25% reported issues accessing markets due to mobility restrictions during this time. Additionally, just 13% reported reducing the size or number of meals and only 20% reported difficulties purchasing food due to reduced income in 2019. While 65% of R2 respondents reported changing diet composition (e.g. eating fewer vegetables or protein) this year, only 17% reported making such changes in 2019.[8]
Farmers and agro-dealers adapting to changing condition with revised sales and stocking practices
Both farmers and agro-dealers continue to find ways to adapt to changing conditions. In R1, 31% of agro-dealers had made changes to stock in response to the impacts of the COVID-19 pandemic, 29% had made changes to sales, and 63% had made changes to operations. In R2, we saw a continuation of these trends, with R2 agro-dealers being statistically more likely to report making changes in all three categories. Compared to R1 agro-dealers, R2 agro-dealers were statistically more likely to report using cashless or electronic transactions to facilitate interactions suppliers and farmers and more likely to report extending credit to farmers. They were more likely to order inputs in advance and to have them delivered. Additionally, compared to R1 agro-dealers, R2 agro-dealers were statistically more likely to make directional changes in the volume of inputs; that is, more R2 agro-dealers reported both decreasing and increasing the total amount of inputs. Moreover, agro-dealers were statistically more likely to adopt a range of preventative health measures in both sales and operations: for example, they were statistically more likely to report encouraging handwashing, sanitizer use, mask use, and social distancing. With the implementation of these measures — and the relaxation of the nationwide curfew — agro-dealers were able to resume normal shop hours. Sixty-five percent of respondents reported closing between 6-8pm normally,[9] and 67% percent of R2 respondents reported closing during this time interval, compared to just 30% of R1 respondents.
Agro-dealers surveyed in R2 were 21% less likely to report lower sales compared to those in R1. They were also 39% less likely to report lower footfall expectations and 40% less likely to report lower sales expectations for the following week. While this may partially due to seasonal patterns in business operations — farmers are more likely to buy inputs in August versus May, as they prepare for the upcoming short rains — it also suggests that both farmers and agro-dealers are adjusting to evolving conditions.
Additionally, gender differentials in food security observed in R1 seem to have been partially resolved in R2. In R1, female crop farmers were statistically more likely than their male counterparts to report that household members were spending fewer days on their own farms and paying higher prices for fertilizer (relative to the previous year); this was not the case in R2. However, in both rounds, female crop farmers were significantly more likely than their male counterparts to report that they had had to rely on assistance from family to cover living expenses and were more likely to report having to reduce the size or number of meals served in the 30 days prior to being surveyed.
RECOMMENDATIONS
At PAD we are carefully considering which interventions would be more likely to empower farmers and agro-dealers to more effectively adjust to ongoing changes in the business environment associated with the pandemic.
Reported financial considerations and product availability are persistent obstacles constraining the ability of farmers to access the inputs they would typically use in the growing season. Capitalizing on our expertise in providing digital services, one potential way to promote farmer resilience would be to dispense advisory content to farmers about less capital-intensive alternatives, such as organic farming techniques (i.e., composting, mulching, monitoring the farm for pests and diseases and crushing pest eggs early on) that do not rely on chemical fertilizers and pesticides that must be purchased in the marketplace.
At the same time, we see potential in the use of digital technologies to promote more effective communication and information sharing across the supply chain. A majority of agro-dealers (63% in R2) reported receiving more than one message from farmers per day. In both R1 and R2, if an agro-dealer reported receiving more than one message from farmers per day this was statistically correlated with a greater number of customers purchasing inputs in the previous week. In R2, 89% of agro-dealers reported communicating with suppliers at least weekly. Establishing a way for agro-dealers to communicate farmer preferences may enable them to overcome supply chain issues: 41% of agro-dealers reported difficulties sourcing certain products, and an additional 14% reported difficulties finding particular brands of inputs.
Finally, while financial services are not within PAD’s ambit, the dramatic increase in the proportion of agro-dealers reporting an inability to meet farmer demand due to insufficient capital suggests that short-term loans or cash grants to agro-dealers could help agro-dealers stay open by allowing them to pay rent, staff, and other fixed costs until farmer demand rebounds. Given that farmers are also cash-constrained, however, cash grants would be particularly effective if coupled with the provision of vouchers to farmers targeted to support the purchase of inputs.
[1] In an effort to build a panel dataset to track change over time, R1 respondents were prioritized. All R1 respondents were called three times before new respondents were called.
[2] WHO Weekly Epidemiological Update, 05 October 2020. Weak testing infrastructure, particularly in rural areas, suggests the total number of cases may be higher; this is corroborated by antibody testing conducted by a team of immunologists from the KEMRI-Wellcome Trust Research Program, and found that 5.6% of study participants contained SARS-CoV-2 antibodies. Nevertheless, the death count remains low compared to other countries across both the developed and developing world.
[3] On September 28, after the end of the survey period, President Uhuru Kenyatta further extended the curfew by two months, with revised hours of 11pm-4am.
[4] In addition to crop farmers, 99 dairy farmers were interviewed. The analysis presented here excludes information reported by dairy farmers.
[5] Two survey respondents (in round 2) did not report their county.
[6] One survey respondent did not report the number of employees and 157 did not report annual sales. Both of these variables were winsorized at the 5th and 95th percentile to adjust for outliers.
[7] Exact timing may vary slightly based on geographic area, but in most counties, the long rainy season starts in February-March and ends in May-June.
[8] This question was added in R2, so this statistic in unavailable for R1.
[9] R1 respondents were asked the following: “At what time do you close your shop normally?” While this question was meant to be asked to new respondents in R2, this was not done due to an error in survey logic.
Two paragraphs of text under the sub-heading “Sample Characteristics” where modified on 27 October 2020 to ensure greater clarity
As Kenya’s Short Rains agricultural season commences Maureen Kuboka, Wanjiku Macharia, Daniel Mokrauer-Madden, Sidney Muchule, JingKai Ong, Yifan Powers and Stefania Pozzi walk us through what MoA-INFO has in store.
A majority of Kenya’s arable land is cultivated in line with two seasons, the Long Rains – which runs from February-March to June-August – and the Short Rains – which runs from September-November to December-January.
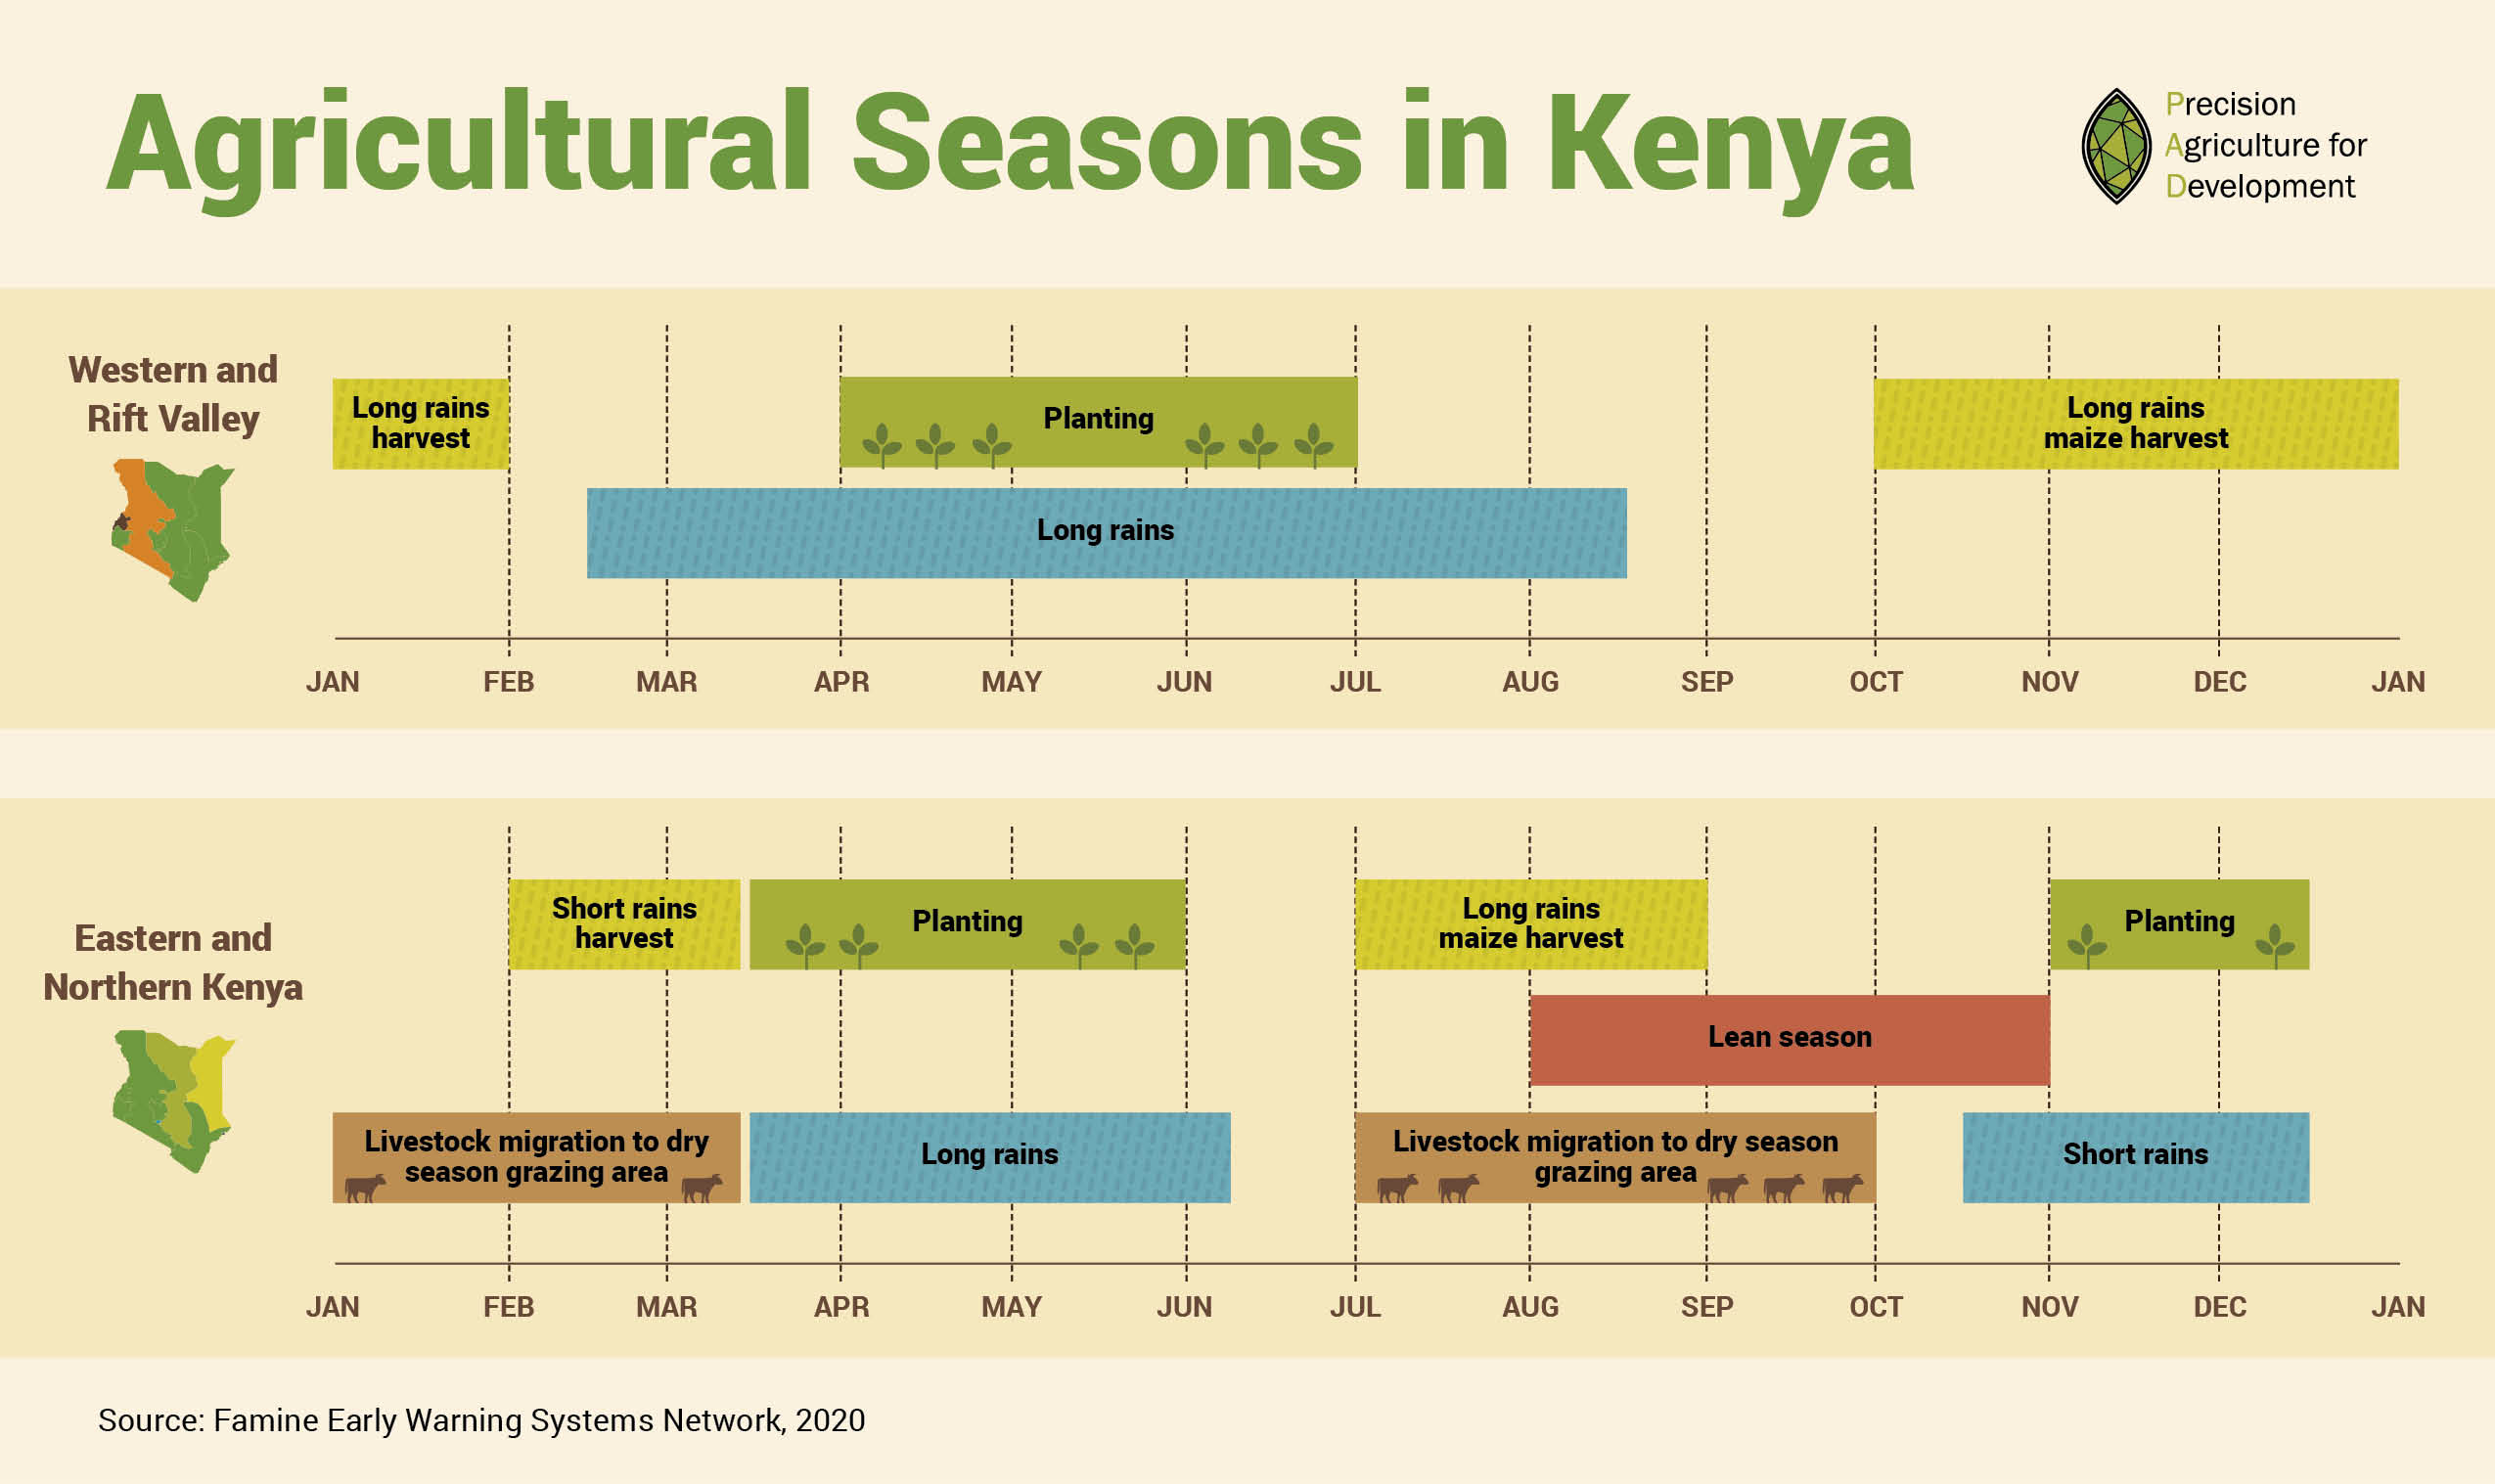
This year will mark the fifth growing season in which MoA-INFO is used to offer digital cropping advice to Kenyan farmers. We now provide advice on ten crops: maize, beans, Irish potatoes , sweet potatoes , pigeon pea, bananas , tomatoes , sorghum, onion , and green gram (mung bean).
As the 2020 Short Rains season gets underway (we commenced sending messages in August to cover pre-planting topics in areas of the country where the rains start earlier), our whole team has been busy working on every aspect of the platform. Here are some updates from some members of the team about what we have been working on:
Maureen Kuboka, Agronomy Associate
Decision support tools enable farmers to access information on optimal input use in an effort to assist them make more informed decisions. Our seed tool allows farmers to learn about maize and bean varieties that are best suited to their agro-ecological zones. In the 2020 Long Rains season, approximately 17,000 farmers accessed the maize seed tool. We identified that many farmers would benefit from information on certified bean seeds which are available in the market. Advisory content on beans was integrated into the seed tool ahead of the Short Rains season.
In preparation for next year’s Long Rains season, the agronomy team has started to compile seed lists for certified maize and beans varieties that will be available for planting in that season. To ensure that the information we offer is relevant and comprehensive we work with the Kenya Plant Health Inspectorate Service (KEPHIS) and agricultural seed companies to source information. We are particularly keen to distribute information on more recently released seeds.
Stefania Pozzi, Global Senior Research Associate
Once agronomic recommendations on a specific topic are finalized, we can start programming on Paddy, our in-house messaging platform. Paddy is built as a set of applications in a programming language called Erlang. When new agronomic content is programmed, we add different applications aligned with whether the information will be accessed as push content (sent to farmers) or pull content (accessed by farmers by navigating an interface). While the advice remains constant, we vary our end messages in an effort to promote user engagement.
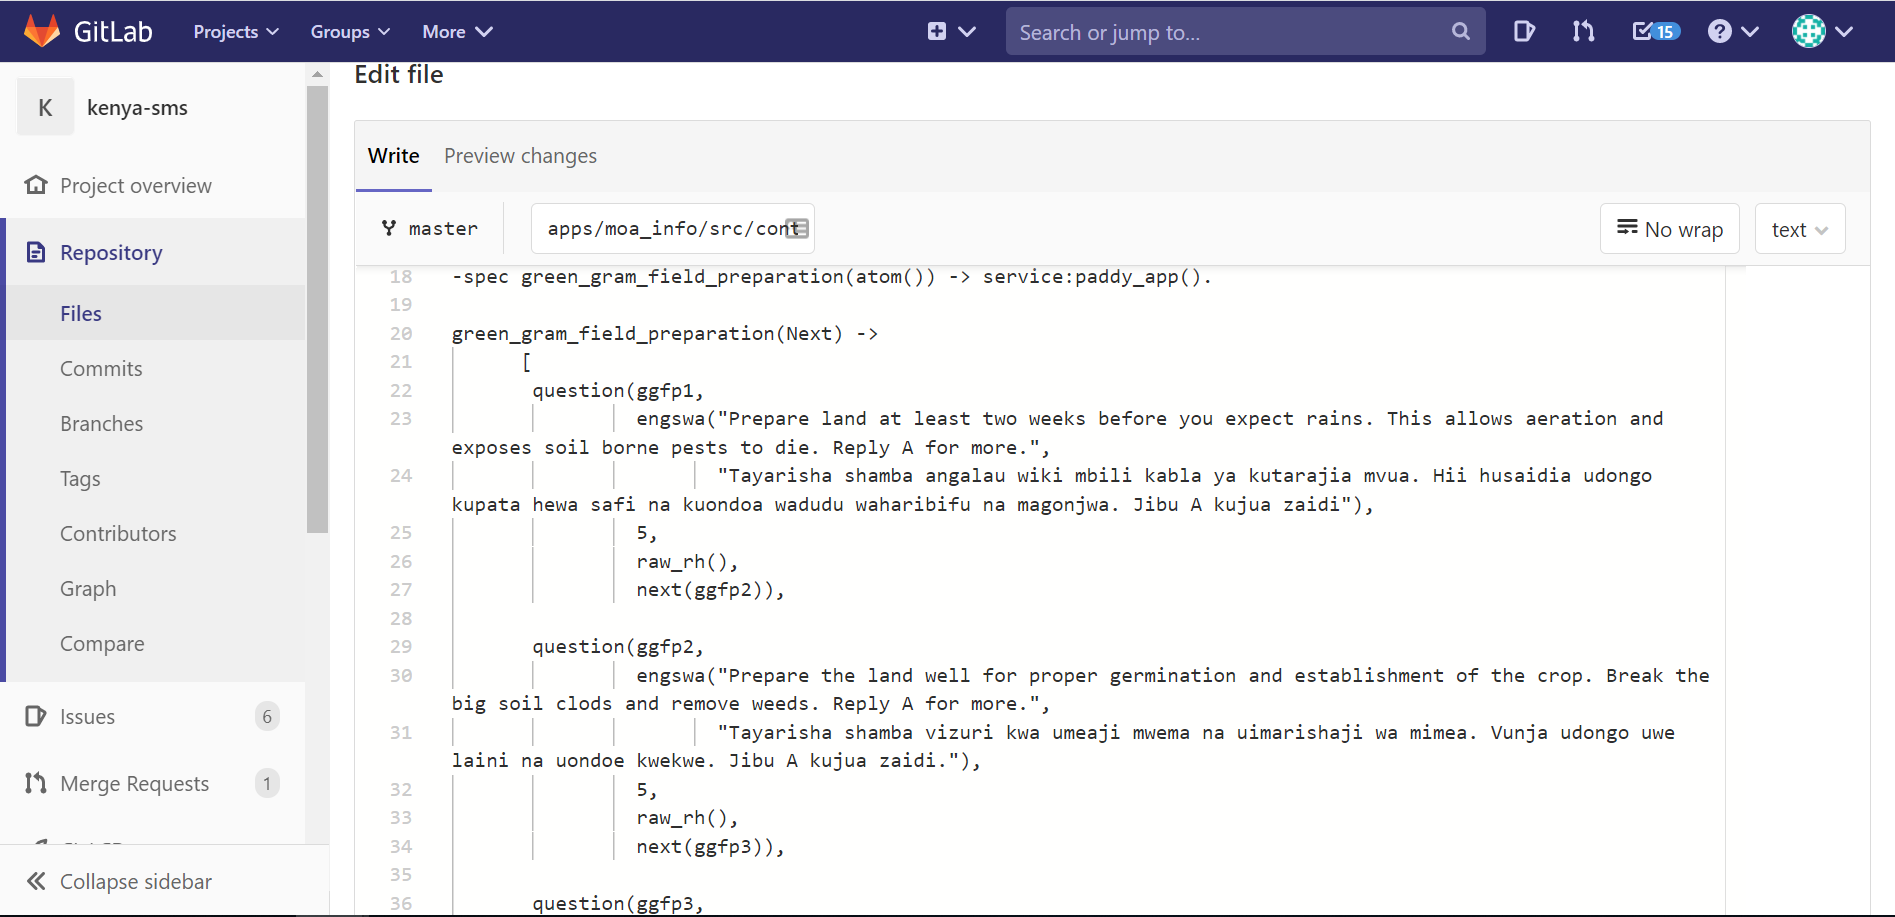
A screen grab from GitLab
We use Gitlab for version control. Each developer starts his/her own Gitlab project branch when modifying or adding Paddy modules, and this branch is only merged in the master branch after modifications have been reviewed and approved by other developers who have been assigned as reviewers. Before sending a merge request, we test all changes with a simulator I run on my Linux machine. We can simulate the interactions between Paddy and MoA-INFO users with a bi-directional interactive communication with a virtual terminal connection. If everything works as expected, changes are ready to be pushed to the remote Paddy repository and a merge request can be formulated.
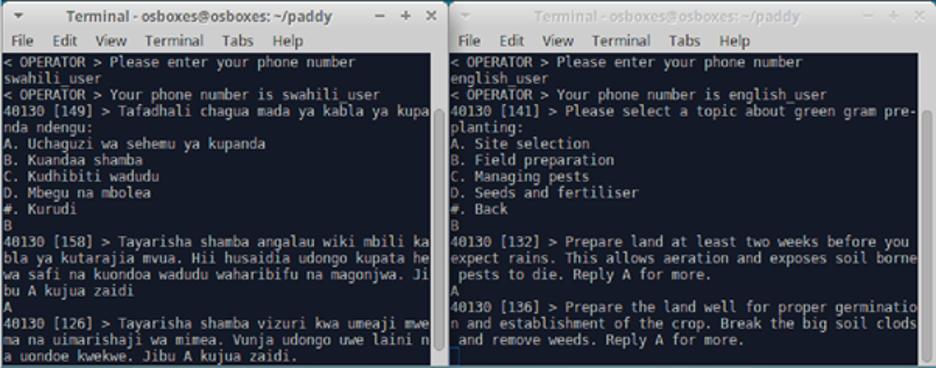
Putting Paddy through its paces on Linux
Wanjiku Macharia, Software Developer
I have designed a scheduler to send invitation messages to users using the MoA-INFO platform. The scheduler is designed so that the information farmers receive is optimized to their activities at that point in the season.
We now have over 150 topics on the Paddy platform, so it is important to make sure that each user receives the most important information at the right time. In order to ensure that our information is relevant and timely, we consider each user’s crop choice, the cropping calendar from our agronomists, and the information we have on the user’s planting dates (some users provide us the exact date; when we do not have that information, we use averages for their area), and associate this information with their unique phone number.
The scheduler is updated each week to ensure that users who have changed their crop choices, who have updated their planting dates, or who have opted out of a cropping series have these preferences and additional information accounted for. Sends from the scheduler are made automatically on Tuesdays and Fridays at a time of day when users are most likely to be responsive.
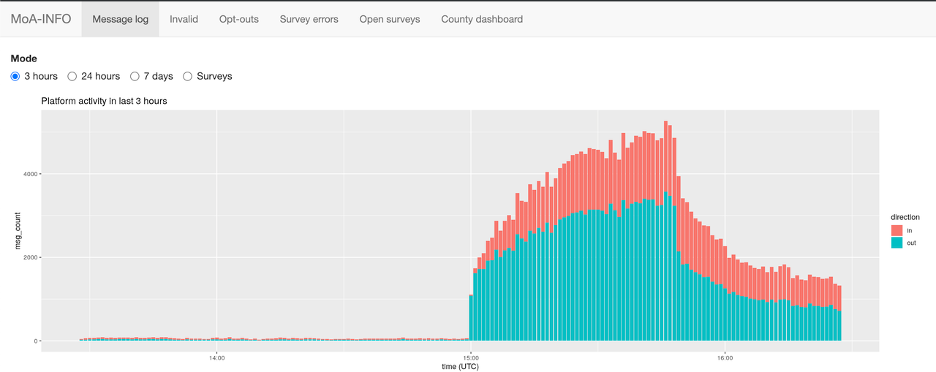
A Tsunami of decision support
The screengrab above captures the scheduler as it pushes content to – and services follow up messages from – Kenyan farmers. Over the first 45 minutes, 67,500 invitation messages are pushed to farmers (blue bars). Incoming messages are captured (red bars) as farmers reply and engage with the content.
Sidney Muchule, Research Associate
For the short rains season of 2020, I am conducting a number of A/B tests to increase our understanding of engagement on the platform. In an effort to provide more – and more relevant – information to our users, we have gradually increased crop offerings. While it is easy to assume that this will have a positive effect on levels of engagement, it is important to better understand the value of such efforts.
To achieve this, we will conduct A/B tests that center around common behavioral science concepts such as choice set design (decision-making based on how options are presented), time inconsistency (hyperbolic discounting and procrastination) and prospect theory. I will also look at how some demographic characteristics we have collected may influence interaction on the platform.
JingKai Ong, Global Research Associate
MoA-INFO’s platform engagement data is housed in a PostgreSQL database which can be accessed securely through a PG Admin site. The database can be queried in order to monitor engagement, check for bugs, and generate up-to-date lists of farmers for the purpose of sending new messages.
As part of ongoing efforts to improve the seed selector tool, the PAD Kenya team regularly writes and runs SQL queries to obtain real-time data for monitoring and evaluation. The database allows the team to easily filter data and prepare ready-to-use datasets that are downloadable as CSV files for data cleaning and analysis in Stata or R. By regularly tracking engagement, and assessing how the tool performs, I can share timely feedback with the team to inform quick iterations for the current season and to generate valuable insights to inform future improvements.
Keeping things secure on PG Admin
Yifan Powers, Global Senior Research Associate
For many farmers in Kenya, particularly in rural areas, local agro-dealers remain a key access point for inputs and agronomic advice on the optimal use of those inputs. This is especially important in the case of maize seed selection. Research has shown that while farmers are, understandably, risk-averse when it comes to adopting new seed varieties, interactions with agro-dealers can be a key factor in convincing them to switch.
However, agro-dealers often lack the knowledge and tools necessary to make optimal and informed maize seed recommendations to their customers. Instead, they often resort to past experience of customer demand in determining which seed varieties to stock and sell. This can lead to a vicious cycle in which farmers are not aware of which varieties are most suitable to plant, and – in response to poor demand – agro-dealers don’t market or stock these varieties as they don’t think that farmers will buy them.
To break this cycle, the PAD Kenya team has decided to experiment with an agro-dealer focused digital intervention to provide agro-dealers with information to learn about the most suitable maize seed varieties in their agro-ecological zone, as well as how best to reach their customers with that information. This project is ongoing and will continue throughout the rest of 2020 and into 2021.
Of course, there are many more members of the team that help to make sure that MoA-INFO best serves our farmers this season. For example, we have a team of enumerators who call MoA-INFO farmers to learn about their existing agricultural practices, collect feedback on the agricultural recommendations that we are developing, gather data on disruptions due to COVID-19, and much more. We also have staff who are developing new programs and partnerships that we hope to launch in coming seasons. Critically, we also have staff who keep the whole team going, particularly as we continue to adjust to working from home while our offices are closed.
Twende! Sisi wa timu ya MoA-INFO tunasema “Tuwasaidie wakulima wa Kenya kuwa na msimu mzuri sana!”
Read more about MoA-Info:
**UPDATE** On December 15, 2021, the Brazilian Ministry of Agriculture canceled the project that had been awarded to PxD by public tender. We continue to work with our regional partners, IICA, and the Government of Brazil to identify complementarities and further opportunities for collaboration.
As those of us in the northern hemisphere return to our home offices after an unusual summer, at PAD we do so cognizant of farmers we serve who continue to navigate a period of escalated uncertainty and precariousness due to the impacts of the COVID-19 pandemic.
At PAD we are motivated and optimistic about the ways in which we can do more to understand our farmers’ evolving needs, and about how we can equip them with empowering information to more effectively mitigate new risks, insulate their households from the pernicious impacts of the pandemic, and promote more efficient and productive agricultural practices.
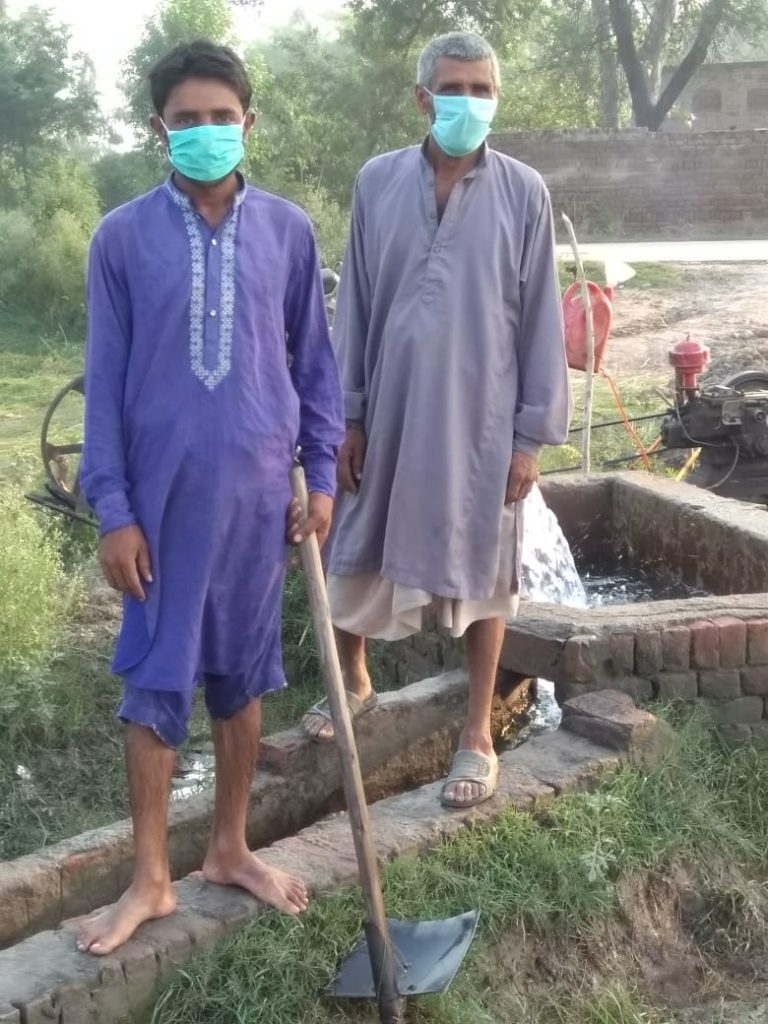
We excited to commence implementing operations supported by a grant and partnership with the International Fund for Agricultural Development (signed on the 28th of August – see our most recent quarterly report for more information) to support the digital extension activities in Kenya, Pakistan and – a new country for PAD – Nigeria.
We are also excited to be pursuing a new partnership with the Government of Brazil and the Inter-American Institute for Cooperation on Agriculture. This new opportunity will scale our digital extension work to farmers in a new hemisphere, on a new continent, and in a new geography, at a time when farmers’ informational needs continue to escalate, and in-person sources of information have become more tenuous.
Watch this space!
MoA-INFO has rapidly developed new capabilities and widened its scope to more effectively serve Kenya’s smallholder farmers. PAD’s Africa Regional Director, Emmanuel Bakirdjian reflects on the first two years of MoA-INFO’s operations.
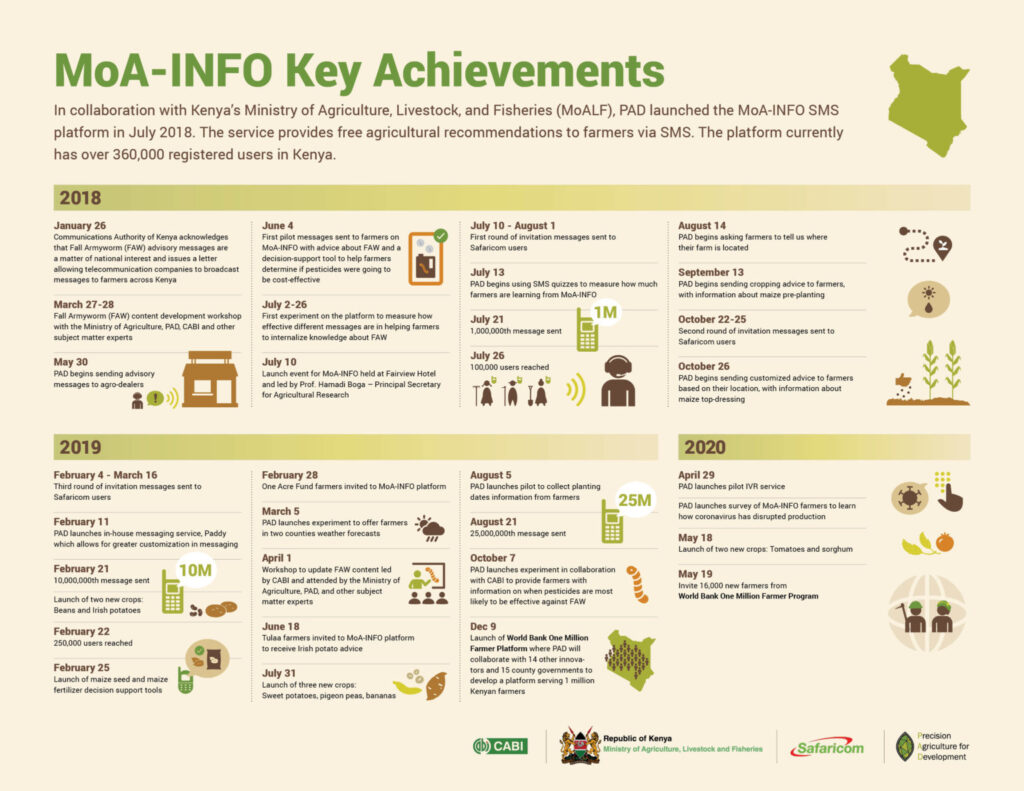
This month marks the second anniversary of the launch of MoA-INFO, Precision Agriculture for Development’s flagship service in Kenya. In just two years, MoA-INFO – which we deliver in partnership with the Kenyan Ministry of Agriculture, Livestock, and Fisheries (MoALF) – has developed from a relatively simple one-way information advisory system, into a set of dynamic, mutually reinforcing, two-way communications tools which empower farmers to make informed agriculture choices across a range of decision points.
The service has grown in scope and reach since it commenced operations with 20,000 farmers in the second quarter of 2018. To date, MoA-INFO has cumulatively serviced more than 420,000 farmers across all of Kenya’s 47 counties. Initially, the platform focused on dispensing advice focused on combating an invasive pest, Fall Armyworm (FAW), but has been expanded to include recommendations on eight subsistence and cash crops and a range of associated pests and diseases. These include (as of July 10th, 2020): maize, beans, Irish potatoes, sweet potatoes, bananas, pigeon peas, tomatoes, sorghum. The system delivers customized advisory, in either English or Swahili, tailored to a farmer’s location and agro-ecological zone. The service is entirely free to farmers and can be accessed from any type of phone.
Farmers can register on the service by texting the word ‘FARM’ or ‘SHAMBA’ to 40130, to receive messages in English or Swahili, respectively. Users can change the language of the service at any time by texting the instruction ‘ENGLISH’ or ‘SWAHILI’. Farmers can access information by texting ‘MENU’ (‘ORODHA’ in Swahili), and can access the FAW monitoring tool by texting the word ‘CHECK’ (‘ANGALIA’ in Swahili).
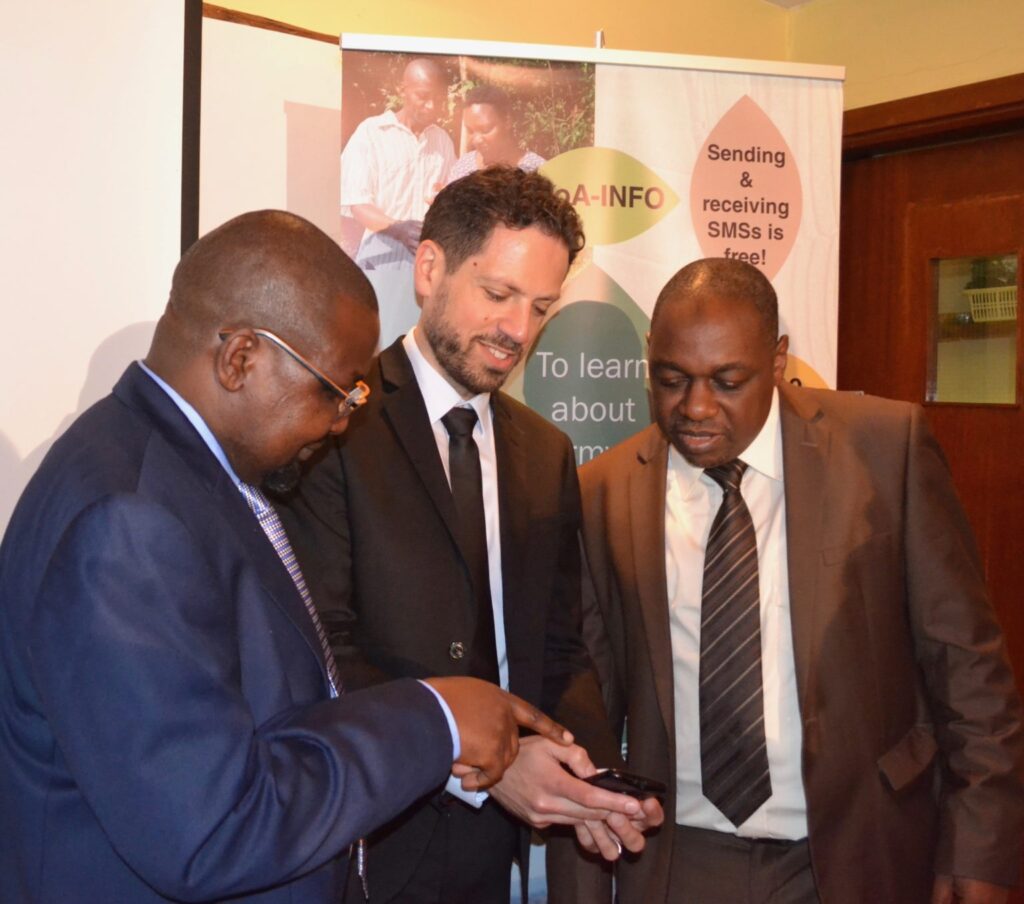
All advisory content is based on recommendations jointly developed with technical experts at the MoALF (including KALRO, the Kenya Agricultural and Livestock Research Organization). The service allows farmers to both pull content, when they are looking for information about crop production or pest control, and receive push messages containing information about farming practices that are timed to coincide with cropping schedules in different parts of the country.
The service also provides farmers with Decision Support Tools (DSTs) to help farmers make evidence-based decisions. PAD has developed tools to help farmers decide on which maize seeds to plant, which fertilizers to apply, and whether pesticides are appropriate based on the scale of pest infestation. Using a farmer’s location, MoA-INFO asks the user filter questions – such as their land size, budget and preferences – and then provides them with recommendations for inputs and practices based on their responses.
Since the launch of the platform, we have run dozens of A/B tests to generate evidence to allow us to improve the design of the service. For example, we have leveraged the results of A/B tests to optimize the way in which we ask farmers for their location, to more effectively encourage farmers to refer peers to the platform, and to improve the way in which we ask farmers about their language preferences on the platform.
We have also used A/B tests and other rigorous research methods to measure the impact of the platform. We have run five A/B tests evaluating the effect of push messages on farmers’ knowledge about FAW using a combination of SMS and phone surveys. In a separate experiment, we partnered with the Centre for Agriculture and Bioscience International (CABI) to test messages leveraging weather modelling to inform farmers about the appropriate application of pesticide tailored to their location. In two of the six trials, farmers were statistically more likely to answer quiz questions correctly than farmers in the control group who did not receive the push messages. Using meta-analysis, we have found that, on average, farmers who received the MoA-INFO messages answered 5% more questions correctly than those who did not. Lastly, trials conducted with CABI and One Acre Fund, respectively, demonstrated that SMS messages increased the self-reported likelihood of adopting recommended practices by 5 to 23%.
As we press ahead, we look forward to continuing to serve smallholder farmers in Kenya with quality, customized, and actionable information. We will continue to expand the platform, both in terms of its reach and its content to support as many farmers as possible with critical and empowering information. Lastly, we want the platform to continue to be an effective tool that is available to the Ministry of Agriculture, and other partners, capable of responding rapidly to new threats confronting farmers, and to help them mitigate new risks as they arise.
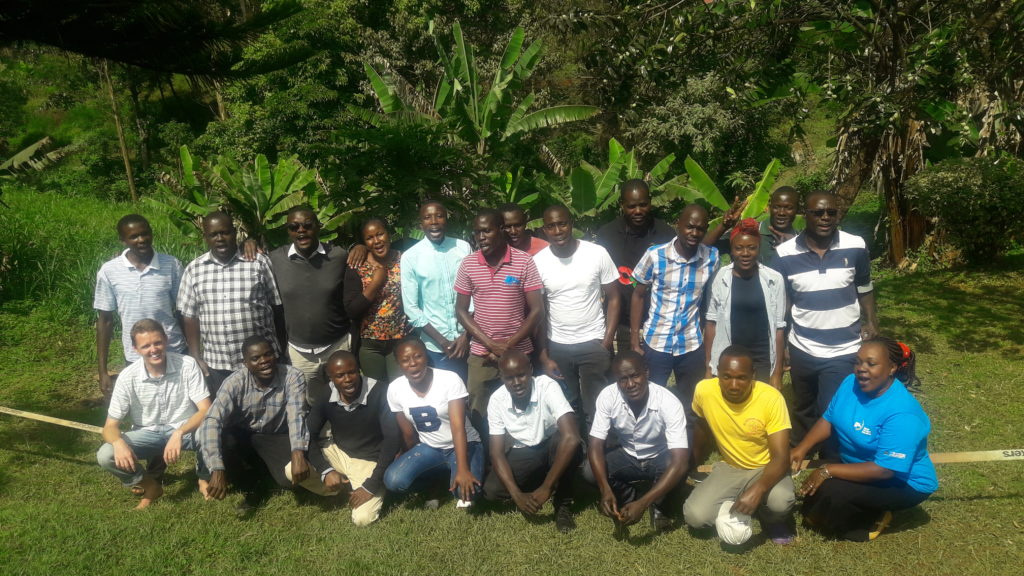
I am immensely proud of what the PAD team has achieved in such a short period of time. Our work has been empowered by the quality of our partnerships with MoALF, KALRO, CABI and Safaricom which have enabled us to scale and iterate so efficiently. In particular, I want to thank Prof. Hamadi Boga, Principal Secretary of the State Department for Agricultural Research in MoALF, who officially launched the platform two years ago. Prof. Boga has been a tireless advocate for the platform, and has promoted and advertised the shortcode number and keywords at multiple conferences and in his interactions with farmers. We look forward to continuing our work with Prof. Boga and his team.
For any questions or comments, please feel free to reach out to us at kenya@precisionag.org.
Sam Strimling, a Research Associate on PAD’s Kenya team, reflects on the results of an initial round of interviews surveying farmers and agro-dealers across Kenya’s agricultural heartland.
AGRO-DEALER & FARMER COVID-19 SURVEY, APRIL-JUNE 2020
Between late April and early June 2020, Precision Agriculture for Development (PAD) interviewed 973 crop farmers and 483 agro-dealers registered to the MoA-INFO SMS platform in Kenya. The results of the survey are intended to assist policymakers and the development community at-large to more accurately assess and respond to the impacts of COVID-19 on rural smallholder farmers and other actors across the agricultural value chain.
An overview of the results of this survey are summarized in this blog post. Please visit our organizational COVID-19 webpage to access survey instruments and background information, and to view a dashboard presenting global, and other country specific, insights from our survey data.
CONTEXT
The novel coronavirus, COVID-19, and associated public health mitigation measures — particularly stay-at-home orders and the closing of public spaces such as markets, schools and religious institutions — have had unique effects on poor rural populations in developing countries. In order to develop policies and interventions that effectively respond to the evolving impacts of the pandemic, policymakers require systematic and reliable data to understand the nature of challenges confronting actors across the agricultural value chain.
PAD is uniquely situated to source and analyse timely and accurate data from farmers and agro-dealers. Through our work with government and non-governmental organization (NGO) partners, our two-way digital advisory systems currently service 3.6 million farmers in eight countries. As a matter of course, we collect and disseminate information to empower farmers to adopt behaviour changes that improve productivity and their livelihoods. This blog post summarizes the results of an initial survey of smallholder farmers and agro-dealers administered through the MoA-INFO service in Kenya.
BACKGROUND
In 2018, PAD launched MoA-INFO, a free two-way SMS platform developed in collaboration with the Kenyan Ministry of Agriculture. The impetus for the service arose in response to a national crisis stemming from a novel and rapidly-spreading invasive pest, the Fall Armyworm (FAW). An import from the Americas, FAW decimated African crops, with disproportionately dire impacts for maize farmers — a staple crop and critical source of nutrition in many sub-Saharan African communities.
Today, through a combination of push messages, menu-based content, and interactive decision-support tools, MoA-INFO provides actionable information to farmers to optimize the cultivation of eight crops (maize, beans, potatoes, sweet potatoes, pigeon peas, bananas, tomatoes, and sorghum) in addition to its foundational advisory content relating to how to monitor and address FAW infestation. Farmers rely on agro-dealers to purchase inputs (seed, fertilizer, pesticide, etc.), but also rely on these traders as a source of advice and repository of expertise. As the service matured, agro-dealers have been recruited to the platform to better inform them about farming best practices and the optimal use of inputs so that they can better service their customers.
At present, approximately 367,000 farmers and 1,246 agro-dealers are registered on the MoA-INFO service across all of Kenya’s 47 counties. Given PAD’s ongoing engagement with farmers and agro-dealers via the platform, we are well-placed to survey and interpret data sourced from smallholder and agro-dealer populations which other NGOs and policymakers may have more limited access to.
SAMPLE CHARACTERISTICS
Between April 29 and June 2, PAD interviewed 973 crop farmers and 483 agro-dealers. Interviews of farmers and agro-dealers covered 44 and 40 counties, respectively. The farmers interviewed were 58% male, 41 years old on average, and 79% grew maize as their primary crop. The agro-dealers interviewed owned Small to Mid-size Enterprises (SMEs), employing an average of two employees and averaging 1.3 million Kenyan Shillings (KSH – approximately US$12,000) in annual sales.
FINDINGS
A COVID-related challenge confronting farmers in Kenya is a reported reduction in working hours on the part of many agro-dealers. While only 3% of surveyed agro-dealers reported closing their stores entirely, a majority (65%) of agro-dealers reported closing between 4-6pm in the seven days prior to being surveyed, earlier than the typical closing hours of 6-8pm.
Decisions to close early may be partially attributable to the Kenyan Government’s 7pm-5am nationwide curfew, which was in place while the survey was in the field. However, 80% of agro-dealers reported an overall decrease in footfall, and 76% reported lower sales relative to the same month last year; this suggests that agro-dealers have not been able to condense their regular operations into fewer hours.
Furthermore, 62% of agro-dealers interviewed reported that they expect future footfall to continue to be low, and the same number reported low expectations for future sales. Typically, agro-dealers report the highest volume of sales during February and August, when farmers buy their inputs to coincide with the planting schedule for Kenya’s long and short rain seasons, respectively. We hope that future surveys will be able to assess the extent to which the expectations reported by agro-dealers in this round are borne out.
The most common reason for diminished farmer footfall offered by agro-dealers — cited by 81% of agro-dealers interviewed — was that farmers had insufficient resources to purchase inputs. Agro-dealers have tried to address this perceived constraint on business by extending credit to trusted farmers. Fifty-four percent of farmers surveyed reported increased prices being charged by suppliers and, in turn, 47% reported having to increase the prices they charged to farmers.
Increases in input prices are corroborated by farmers: of the 35% who purchased fertilizer, 44% reported price increases, and of the 19% who reported purchasing pesticides, 50% reported a price increase. While only 6% of farmers purchased seeds, 58% of these farmers reported price increases.
Reported price increases were not limited to inputs: 83% of farmers interviewed reported an increase in the price of maize. While price increases are not uncommon at this time of year (the ‘lean season’), the reported effect was particularly dramatic: 86% of farmers reported difficulties buying food due to market changes, and 46% reported having to reduce the size or number of household meals. Moreover, 75% of farmers interviewed reported having to eat into savings, and 55% reported borrowing money in the last 30 days, to cover living expenses. These patterns of reported dis-saving and borrowing may limit farmers’ investment budgets and demand for inputs in the next agricultural season. Moreover, these trends may be further compounded by disruptions to the labor market in the agricultural sector: 33% of farmers reported hiring workers for fewer days to do work on their farm than at the same time last year, and 29% reported working fewer days on others’ farms.
Female crop farmers reported greater food insecurity than their male counterparts across several measures: compared to male farmers, female crop farmers reported that household members reported spending fewer days on their own farms and paying higher prices for fertilizer. Female crop farmers were also significantly more likely than their male counterparts to report that they had had to rely on assistance from family to cover living expenses and having to reduce the size or number of meals served in the 30 days prior to being surveyed.
To inform a better understanding of the persistent effect of COVID-19 on food security, including potential differential effects by gender, we plan to interview farmers over time to monitor changes in staple food prices (relative to the same time the previous year). PAD will commence a second round of surveys in July to monitor how the situation evolves, and to assess shifts in reported welfare and expectations associated with a relaxation or termination of restrictions on movement.
In good news, farmers seemed optimistic about their forthcoming harvests: 52% of farmers interviewed reported that they expect a more bountiful harvest than they did in the previous year; 66% reported that they expect to sell their produce in the market at a higher price; and just 14% reported that they expect not to be able to sell part of their harvest. Farmers indicated that expectations of improved harvests were premised on improved rainfall, as well as higher observed market prices, which led farmers to expect higher prices for future harvests. A majority of farmers (86%) reported having storage space which may enable them to more readily withstand potential market disruptions.
Agro-dealers continue to look for ways to best serve farmers, and adapt to an adverse business environment, with 29% reporting that they had implemented changes to sales. Of the subset of farmers who said they had made such changes, 21% reported allowing farmers to pay for inputs using mobile money. While payment via M-PESA – the mobile money platform operated by Kenya’s largest mobile network provider – had been common throughout Kenya prior to the outbreak of COVID-19, these agro-dealers specifically mentioned instituting these transactions as a means of adapting to the pandemic. Overall, 62% of agro-dealers reported changes in operations due to COVID-19, the two most commonly reported were availing farmers of hand washing options (50%) and encouraging mask use (34%). Moreover, while 26% of agro-dealers stated they were unable to purchase inputs from suppliers – and a majority of these agro-dealers (58%) attributed this difficulty to constrained supply of inputs – many reported making changes to how they stock inputs in order to meet farmers demand. Reported changes included using mobile money when transacting with suppliers, and changing the quantity, time frame, or delivery method for orders. Overall, just over a quarter of agro-dealers (27%) reported that they foresee being unable to meet farmer demand.
While both farmers and agro-dealers have encountered economic challenges related to COVID-19, there nonetheless appears to be broad agreement that, from a public health standpoint, government measures constitute the right course of action: 76% of farmers assessed government actions as “very effective” or “somewhat effective” in mitigating the spread of the virus. Seventy-three percent of agro-dealers and 67% of farmers said that they feared contracting the virus, and 33% of agro-dealers named loss of wage income as a concern.
RECOMMENDATIONS
Taken together, the data collected so far suggest several potential strategies to insulate smallholder populations and agricultural value chains that rely on smallholder productivity from potentially damaging impacts associated with COVID-19. While many farmers remain optimistic about future harvests, there are signs of input market disruptions and increasingly stressed household consumption.
Providing cash transfers and social assistance to smallholder populations will help to insulate poor farming households from the effects of increased market prices for maize flour and other foodstuffs, and help to sustain demand for agricultural inputs to support the forthcoming planting cycle. On May 12, the Indian government released a relief package valued at approximately US$265 billion, which combines targeted financial support (including loans, cash transfers, and wage increases) with direct provision of agricultural staples (i.e., wheat, rice, and pulses) at the individual and household level. A similar package would likely go a long way toward relieving the financial distress and consumption difficulties faced by Kenyan farmers.
Farmers reported strong demand for digital information relating to the pandemic: 88% of farmers surveyed reported an interest in receiving digital updates related to COVID-19. Of those interested, 74% requested public health advisory content, 47% requested news-style updates relating to the progress of the pandemic (cases, recoveries, etc.), and 34% requested updates about pandemic-related government policies and actions.
Overall, 98% of agro-dealers reported communicating with suppliers via mobile phone, and 70% reported receiving messages from farmers about inputs at least once a day. By establishing formal channels across the value chain, farmers can communicate their needs and preferences. Better informed agro-dealers may be better positioned to overcome challenges to meeting farmer demand — for example through communicating farmer requests to suppliers, thus ensuring that needed inputs are available. Additionally, enabling agro-dealers to efficiently communicate with local suppliers to gather information on input availability and prices could help them procure inputs on time. Finally, such a channel would assist agro-dealers in implementing changes to how they stock, which about one-third have already reported adopting, including using cashless transactions and having inputs delivered.
CONCLUSION
As part of the World Bank’s One Million Farmers initiative, PAD is working with 14 start-ups across Kenya which collectively are working to deploy digital technologies toward improving market linkages, input delivery, and provision of crop insurance, credit, and extension advice. At an organizational level, we hope to use the information collected here to more effectively design and implement a service that will empower smallholder farmers and agro-dealers with information to more effectively mitigate challenges associated with this unprecedented disruption to the supply chain.
PAD’s theory of change is based around evidence that well-sourced, timely and actionable information can empower farmers and policy-makers to act in the world to improve lives and secure livelihoods. This theory is core to the design and implementation of the services we deliver across all of our projects globally. Sourcing opinions and data from farmers to more accurately understand their challenges and aspirations is critical for delivering timely information for practical application in farmers’ fields and households. The information collated through this survey and similar surveys in other geographies is intended to contribute to the evidence base in a rapidly shifting context with new and ill-defined challenges. We welcome your feedback and interest in partnering with us as we iterate our work.
This blog post was updated on 07.06.20 to include new gender-related insights
Make an Impact Today