Customized Weather Forecasts for Improved Farmer Decision Making
- May 1, 2024
- 7 minutes read

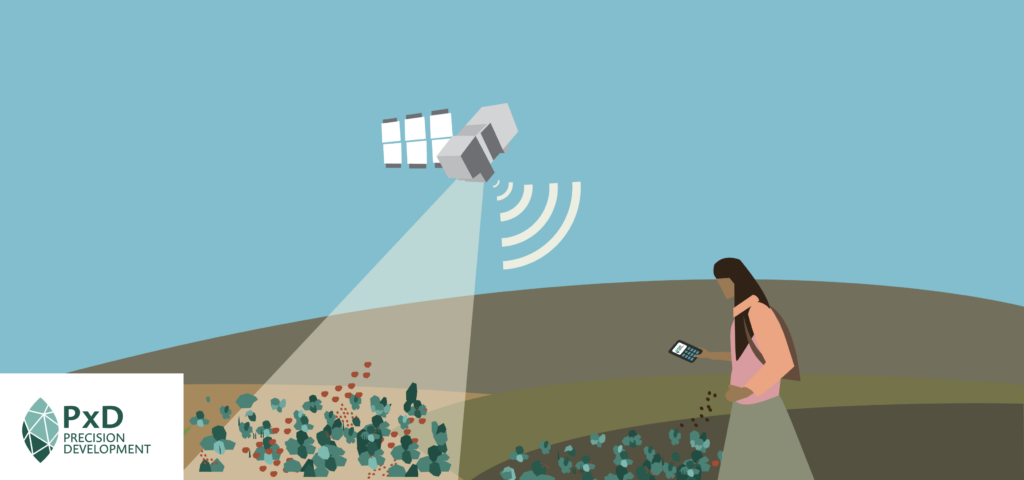
In our services for farmers, PxD aims to provide timely, relevant, and actionable information to help them make better decisions. In this post, we reflect on our efforts to design a customized weather forecast product for coffee farmers in Karnataka, India as part of PxD and the Coffee Board of India’s existing advisory service, Coffee Krishi Taranga. The development of this service has been generously funded by a grant from the Walmart Foundation, with research activities funded by the J-PAL King Climate Action Initiative.
Better weather forecasts for farmers in Karnataka
Uncertainty about weather is a significant concern for farmers around the world, who value information that can better predict upcoming weather. However, the accuracy of weather forecasts varies drastically across countries (Linsenmeier and Shrader, 2023). This is reflected in PxD’s internal survey data from Karnataka, India, where less than half of farmers trusted the rainfall forecasts they had access to (Cole, Harigaya, and Surendra, 2024). While lower forecast skill in low-income countries is largely a result of inadequate ground observation infrastructure (Linsenmeier and Shrader, 2023), improvements in forecasting models, forecast calibration, and the availability of remotely sensed weather data have enabled well-resourced forecast providers to improve services.
Apart from forecast skill, we observed that commonly available rainfall forecasts in India are deterministic and not probabilistic; that in rural areas these forecasts are typically provided at a district or block level; and that rainfall forecasts are typically provided for the upcoming five days, and, occasionally, ten days, depending on the source. We partnered with Climate Forecast Applications Network to provide farmers in rural Karnataka with skilled forecasts that are informationally richer—i.e. probabilistic at sub-block-level granularity—and at lead-times of up to fifteen days.
Assessing whether to provide farmers with informationally richer forecasts
To design a mobile-phone-based weather forecast service customized for coffee farmers, PxD conducted qualitative interviews with farmers and extension officers to identify weather-sensitive agricultural practices in coffee cultivation; the ideal weather for each practice; actions farmers can take using forecasts; and constraints to taking such actions. We followed this with focus group discussions to evaluate farmers’ comfort with forecasts in different formats. Finally, we conducted an experimental study with 1,212 farmers to identify how farmers engage with probabilistic forecasts to make decisions (Cole, Harigaya, and Surendra, 2024).
The experimental study was designed as a “lab-in-the-field” experiment, in which farmers played two hypothetical decision-making games. Over multiple rounds, farmers interacted with probabilistic weather forecasts and made decisions with weather-dependent payoffs. Farmers then observed a weather realization and received a score for the round based on the suitability of their decision for realized weather conditions. After observing the outcome of the round, they moved on to the same sequence of decisions in the next round. The goal of this experiment was to understand whether farmers accurately interpret the probabilities in such forecasts, whether they trust probabilistic forecasts and act on them, and how their trust in forecasts evolves as they observe forecast performance.
In this experiment, we also assessed whether a light-touch probability training video might improve farmers’ ability to use probabilistic forecasts, and whether a light-touch video providing climate change advice impacted their inclination to trust the forecasts (since climate change has led to more unpredictable weather in the region)1The informational video treatments in the study were designed in-house in a real team effort. Credit to Sejal Luthra and Vaishnavi Surendra for the scripting; Niek de Greef and Vaishnavi Surendra for video design; Saniya T for translation; Saniya T, Naveena S P, and Mangala B for voice-over, and Julian Emdon at Emdon videos for video editing!. Finally, we assessed farmers’ demand for a voice-call-based weather forecasting service that would provide weekly probabilistic weather forecasts.
The schematic below describes how a particular weather forecast in the game is designed to mimic the real world. Forecasts in the games vary in format, providing us with valuable insights on the formats best suited for PxD’s weather service.
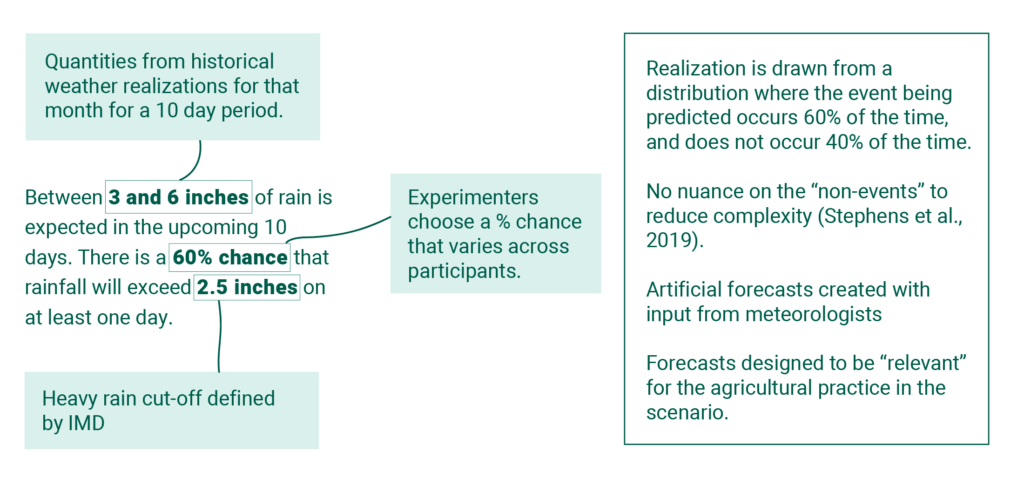
Figure 1. Designing hypothetical forecasts for the study
High demand for improved forecasts among farmers in Karnataka
To accurately gauge farmers’ demand for a voice-call-based probabilistic rainfall forecast service, our study uses a standard method (Becker, DeGroot, and Marschak, 1964) to determine how much farmers are willing to pay for the service, without overestimating or underestimating the value. The procedure followed is described in the accompanying figure.
We found that 98% of farmers were willing to pay non-zero amounts for the service, indicating high demand for more weather information. On average, farmers in the study were willing to pay INR26 (or USD0.31) per month for weekly forecasts, which amounts to around 10% of the daily wage in Karnataka.
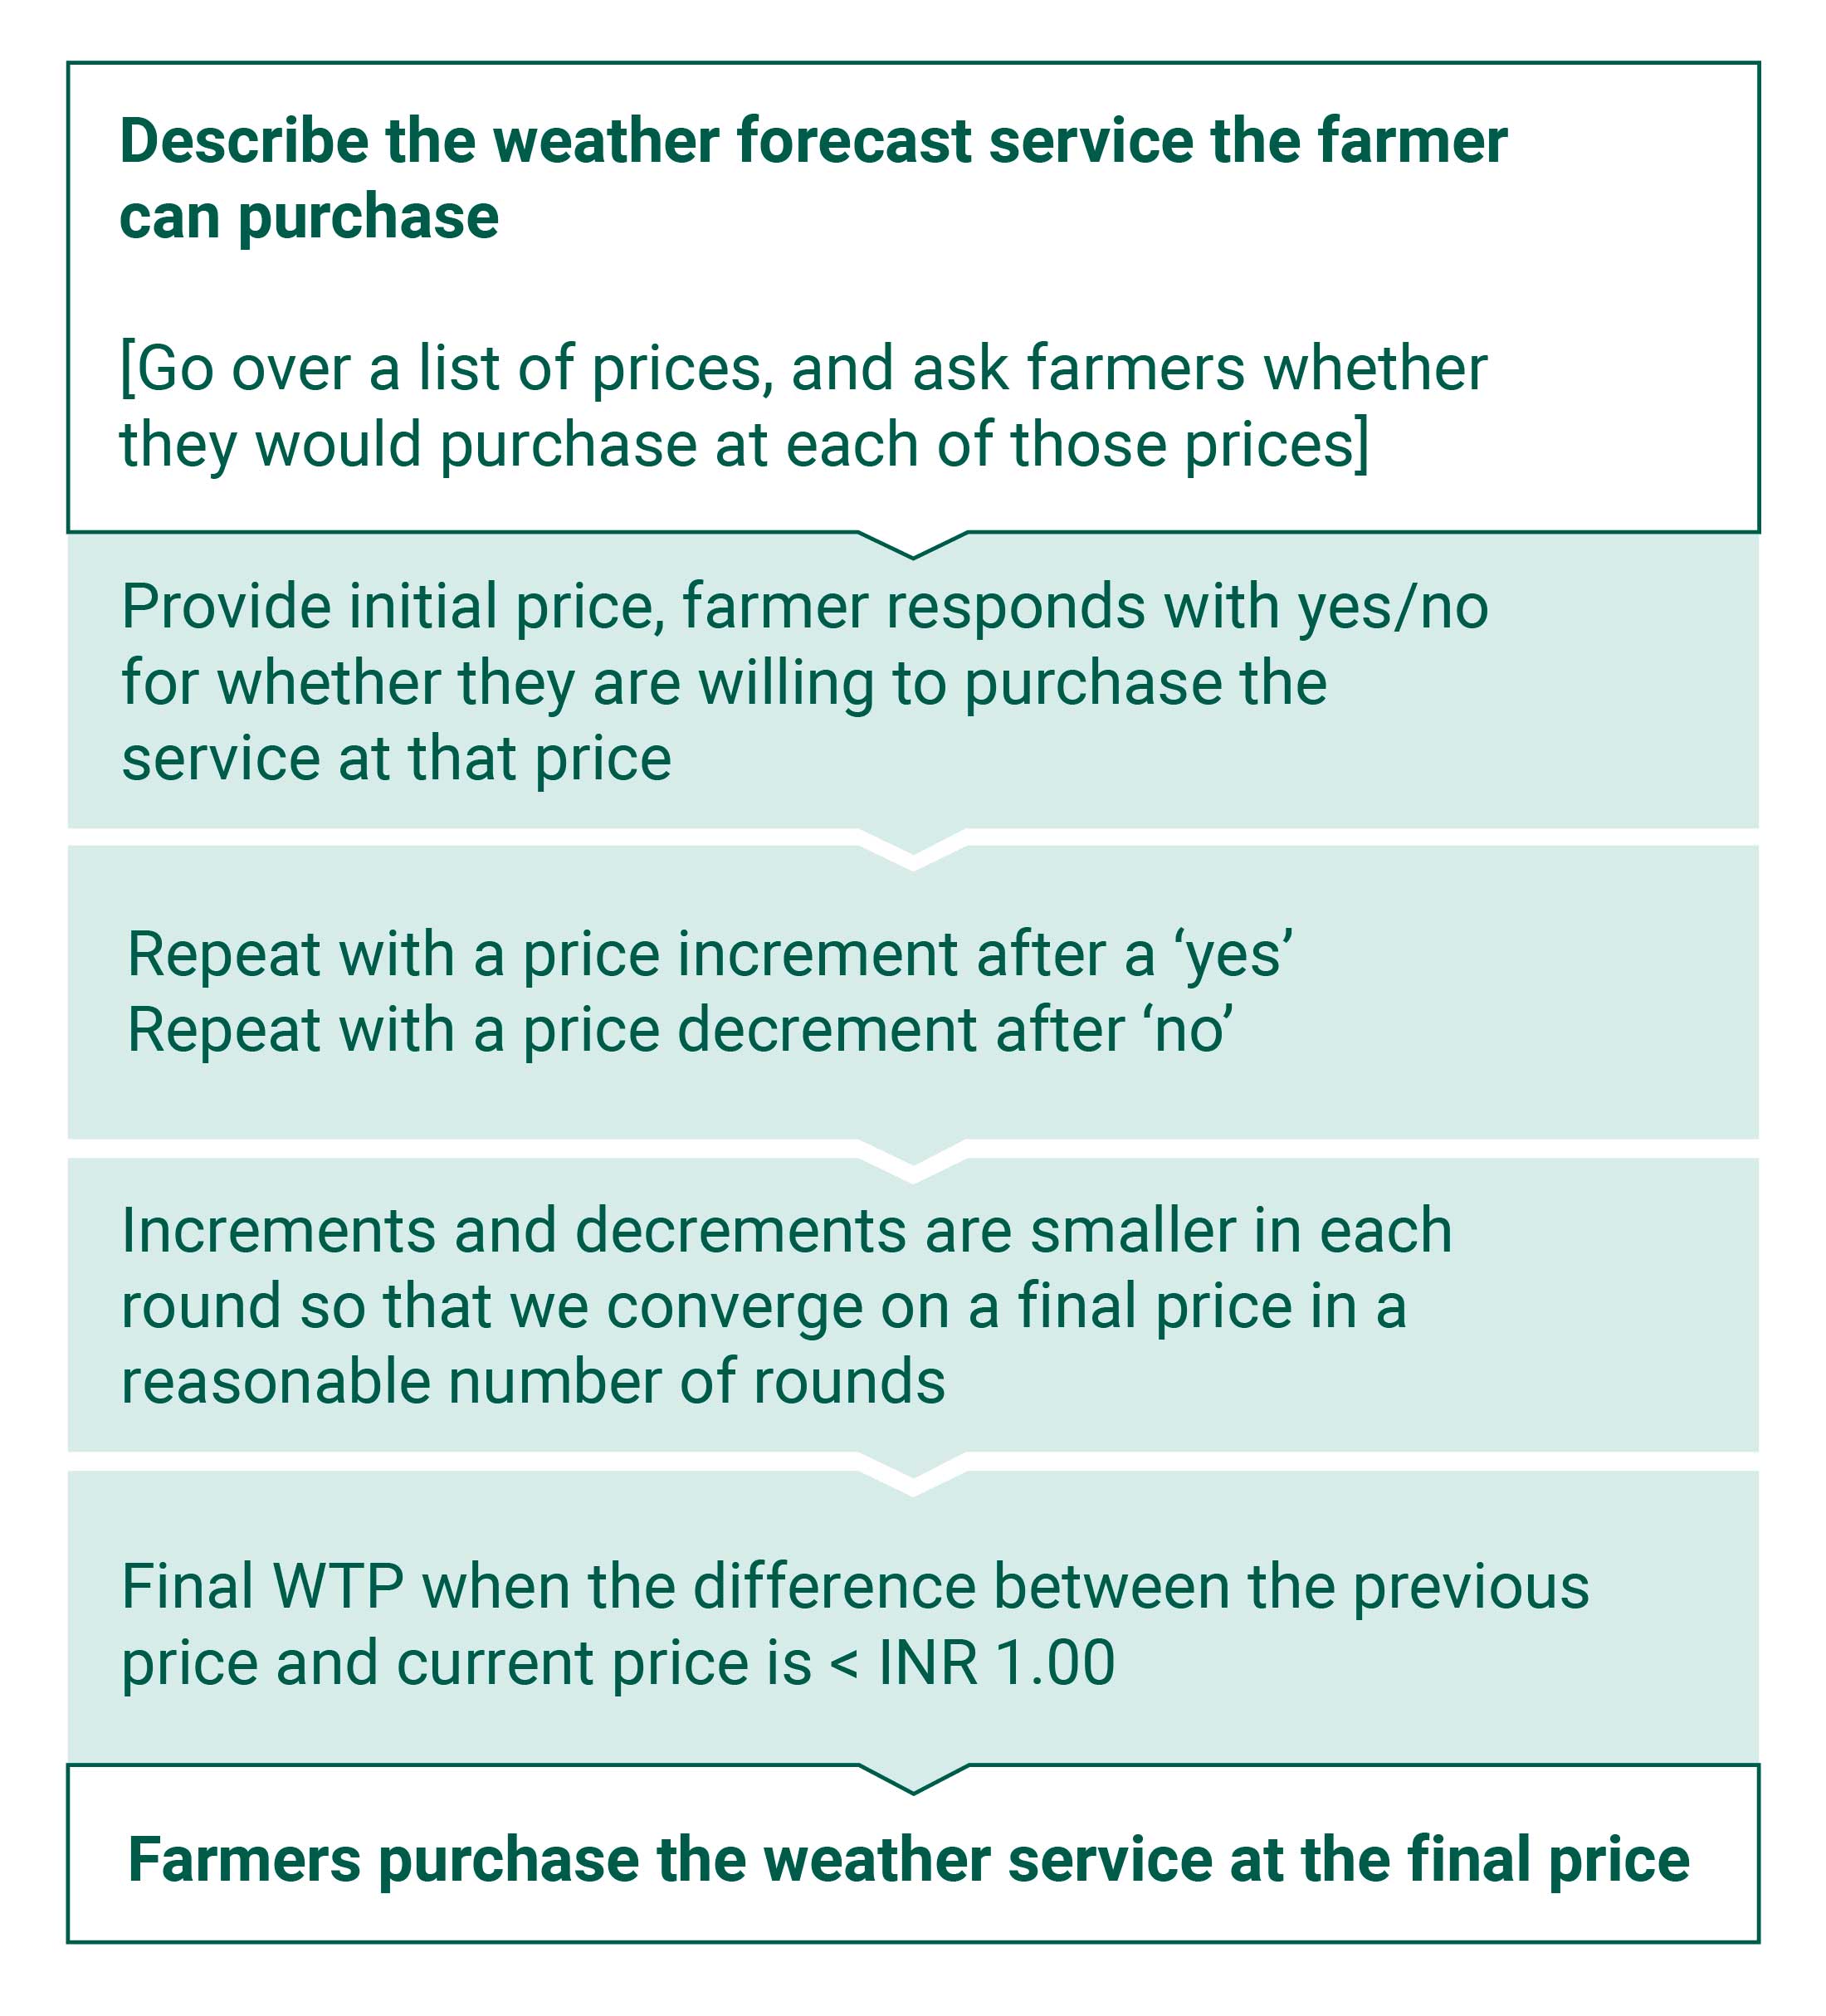
Figure 2. Assessing farmers’ willingness to pay for a voice-call-based weather forecast service
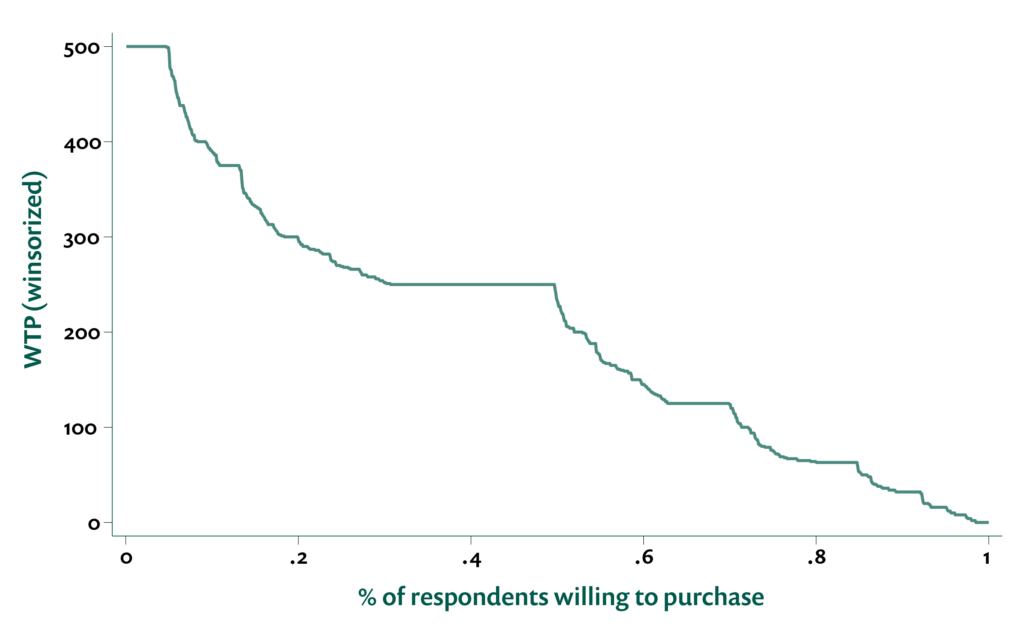
Figure 3. Demand for weather forecasts in Karnataka, India
Interpreting probabilistic forecasts
The results from the experimental games show that most farmers understand probabilities well. Most farmers correctly chose the more likely forecast when given a choice between two, and the higher the probabilities in rainfall forecasts, the more likely farmers were to expect rain after engaging with the forecast. This suggests that farmers used the information provided in the probabilistic forecasts, or that their expectations take into account the ‘signal’ in the probabilistic forecast.
However, we found that the informational videos had minimal effect. Farmers who watched the probability training video initially did better in the games that followed, but this improvement diminished after they experienced false alarms—instances where the forecasted event did not occur—even though forecasts were presented in probabilistic rather than deterministic terms.
Farmers are highly sensitive to false alarms
A stark finding in this study was the effect of false alarms (referred to above). Farmers who experienced false alarms performed worse in subsequent rounds and would pay less for the real-world weather forecast service. This suggests that farmers adjust their opinions about the accuracy of forecasts based on their experiences with both the forecasts and the actual weather conditions that follow a forecast. These findings imply that initial experiences can influence farmers’ trust in a new service. They also imply that it is important to consider strategies to build trust, and to emphasize the probabilistic nature of forecasts in product design. We intend to study farmers’ responses to forecasts further and to find ways to increase trust, while also acknowledging the occurrence of false alarms in our real-world pilot of the weather forecasting service.
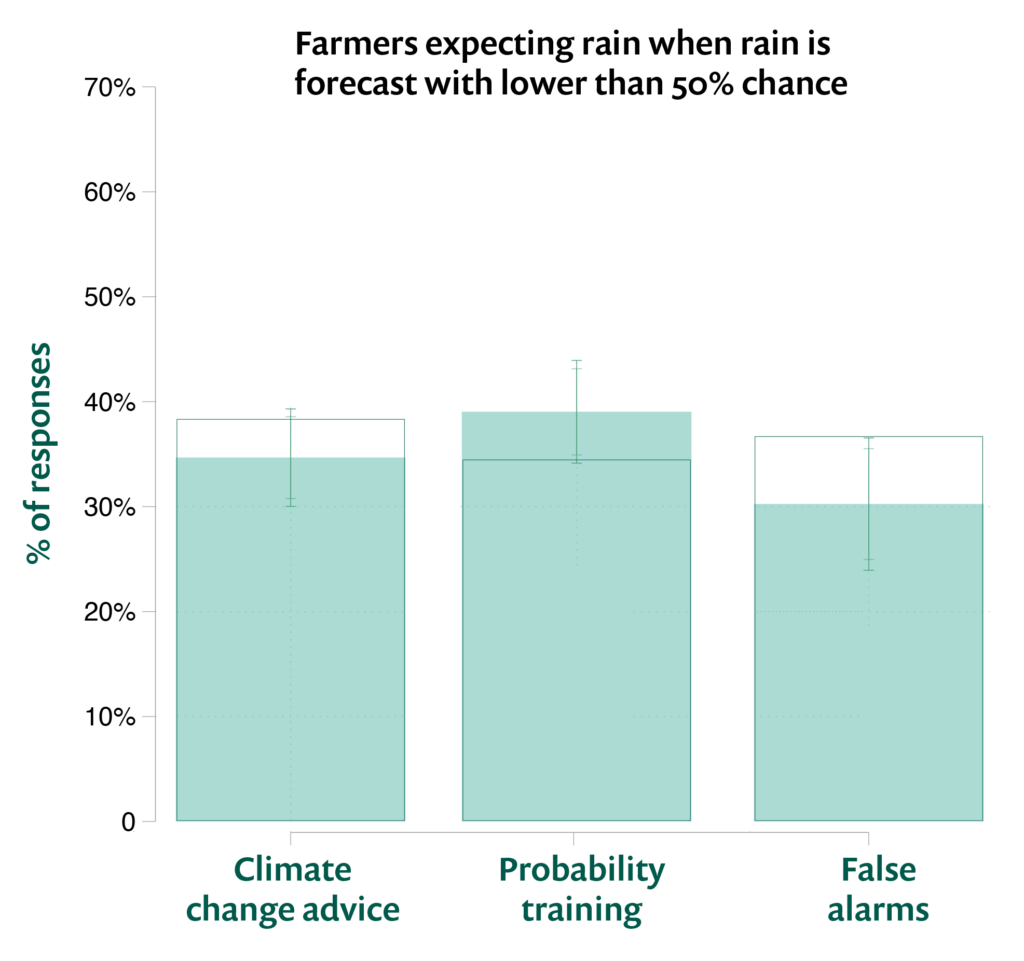
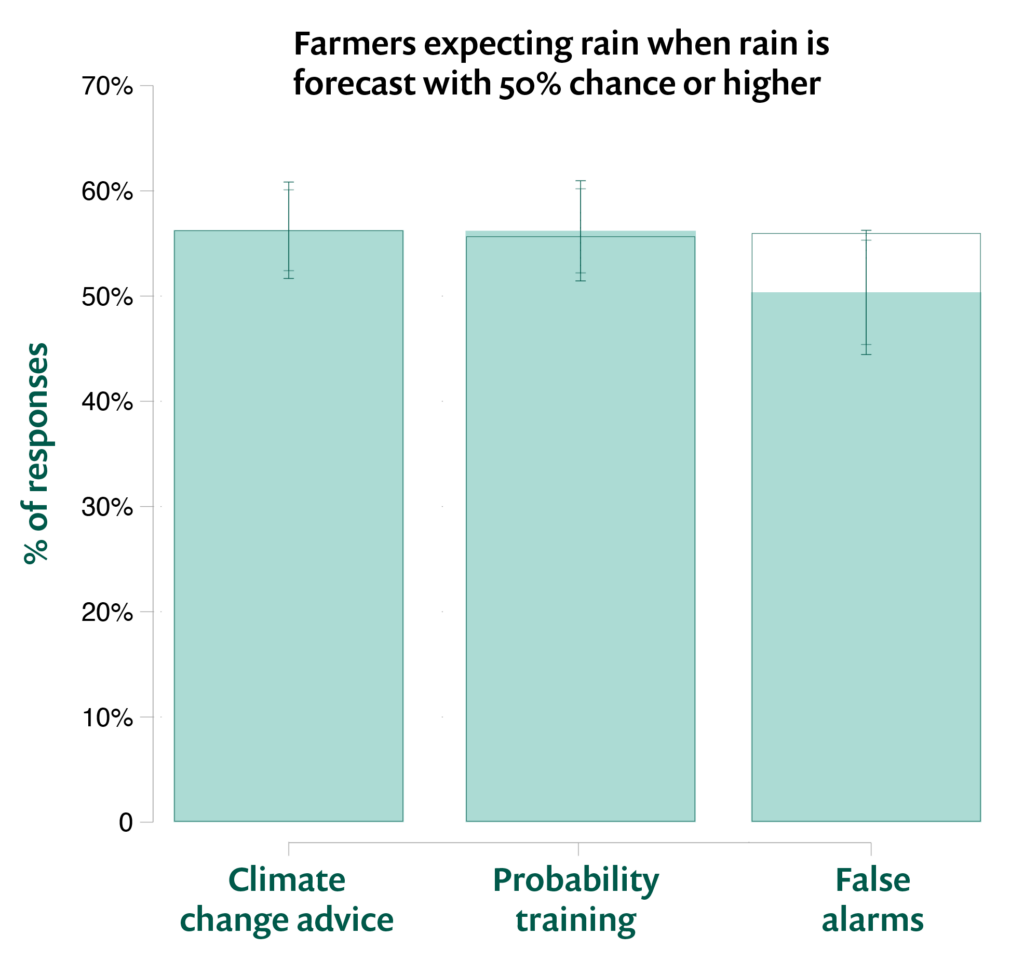
Figure 4. Farmers are less likely to expect rain after a false alarm
Onward!
The PxD team is prototyping a voice-call-based weather forecasting service for coffee farmers in Karnataka using these insights. The service has already been rolled out to the first few farmers who participated in this study!
Credit to all former and current members of the Coffee team at PxD India for their diligent research and development of the weather forecasting service. A special shout-out to Sejal Luthra, Senior Research Associate at PxD, and to Kannan Sobti and Bhawna Mangla at J-PAL India for their excellent research management and assistance on the experimental study; and to Sannihit, Program Associate at PxD for leading the launch of the pilot. A research paper based on our study is here, authored by Shawn Cole, Tomoko Harigaya, and Vaishnavi Surendra.
References:
Becker, Gordon M., Morris H. DeGroot and Jacob Marschak (1964). “Measuring utility by a single response sequential method,” Behavioral Science, 9(3): 262–232.
Cole, Shawn, Tomoko Harigaya and Vaishnavi Surendra (2024). “Weather forecasts and farmers’ beliefs after false alarms,” Working Paper.
Linsenmeier, Manuel and Jeffrey Shrader (2023). “Global inequalities in weather forecasts,” Working Paper.

Stay Updated with Our Newsletter

Make an Impact Today